About Github Graph
Github Contribution Graph
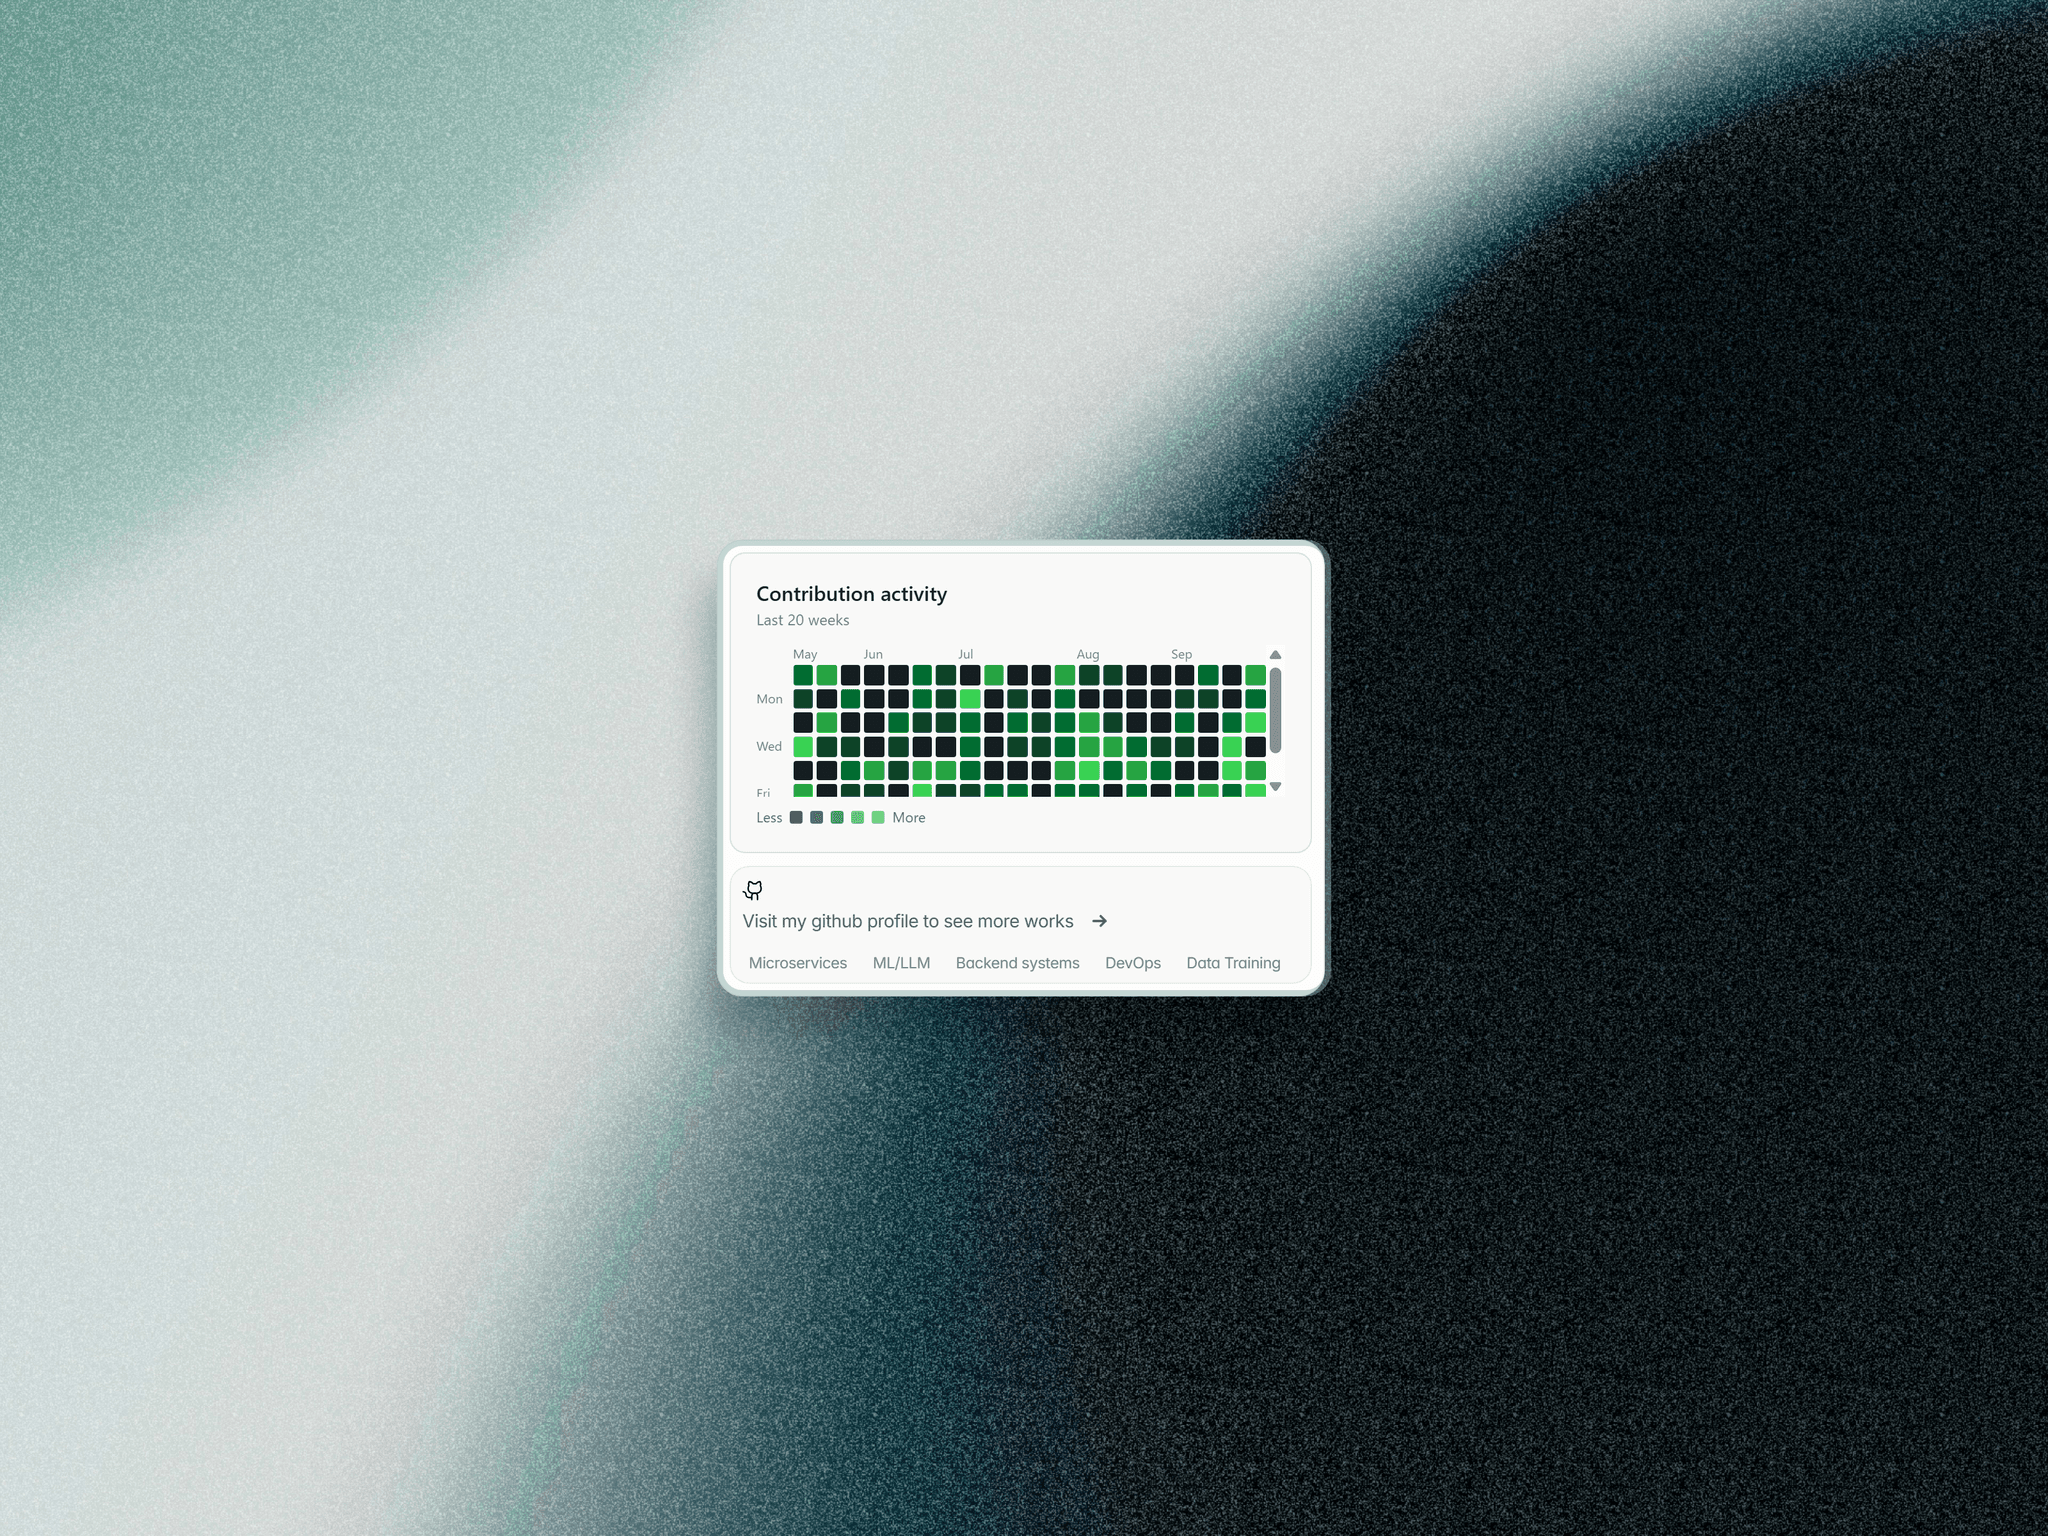
Show your coding activity on your Framer site with a GitHub-style contribution graph. Type in a GitHub username or paste a profile URL and the component pulls in the last year of real contribution data. Leave the field blank and it shows a generated demo graph, so it looks good while you design.
Features
Live GitHub data from a username or full profile URL, with a demo-data fallback if the user isn't found or the request fails
Animated cell reveal with adjustable duration and stagger, which can replay when the graph scrolls into view
Hover tooltips showing the contribution count and date for each day
Customizable colors for all five activity levels, plus background, text and accent
Adjustable weeks, days per week, cell size, gap and corner radius
Optional frame, title, subtitle, weekday labels, month labels and legend
Static-safe rendering: animations and hover effects are disabled on the Framer canvas and in exports
Good for Developer portfolios, personal sites, and "About" or "Activity" sections.
Setup Drop the component onto your canvas, enter a GitHub username in the properties panel, and style it to match your site.