About Graph Canvas
Details
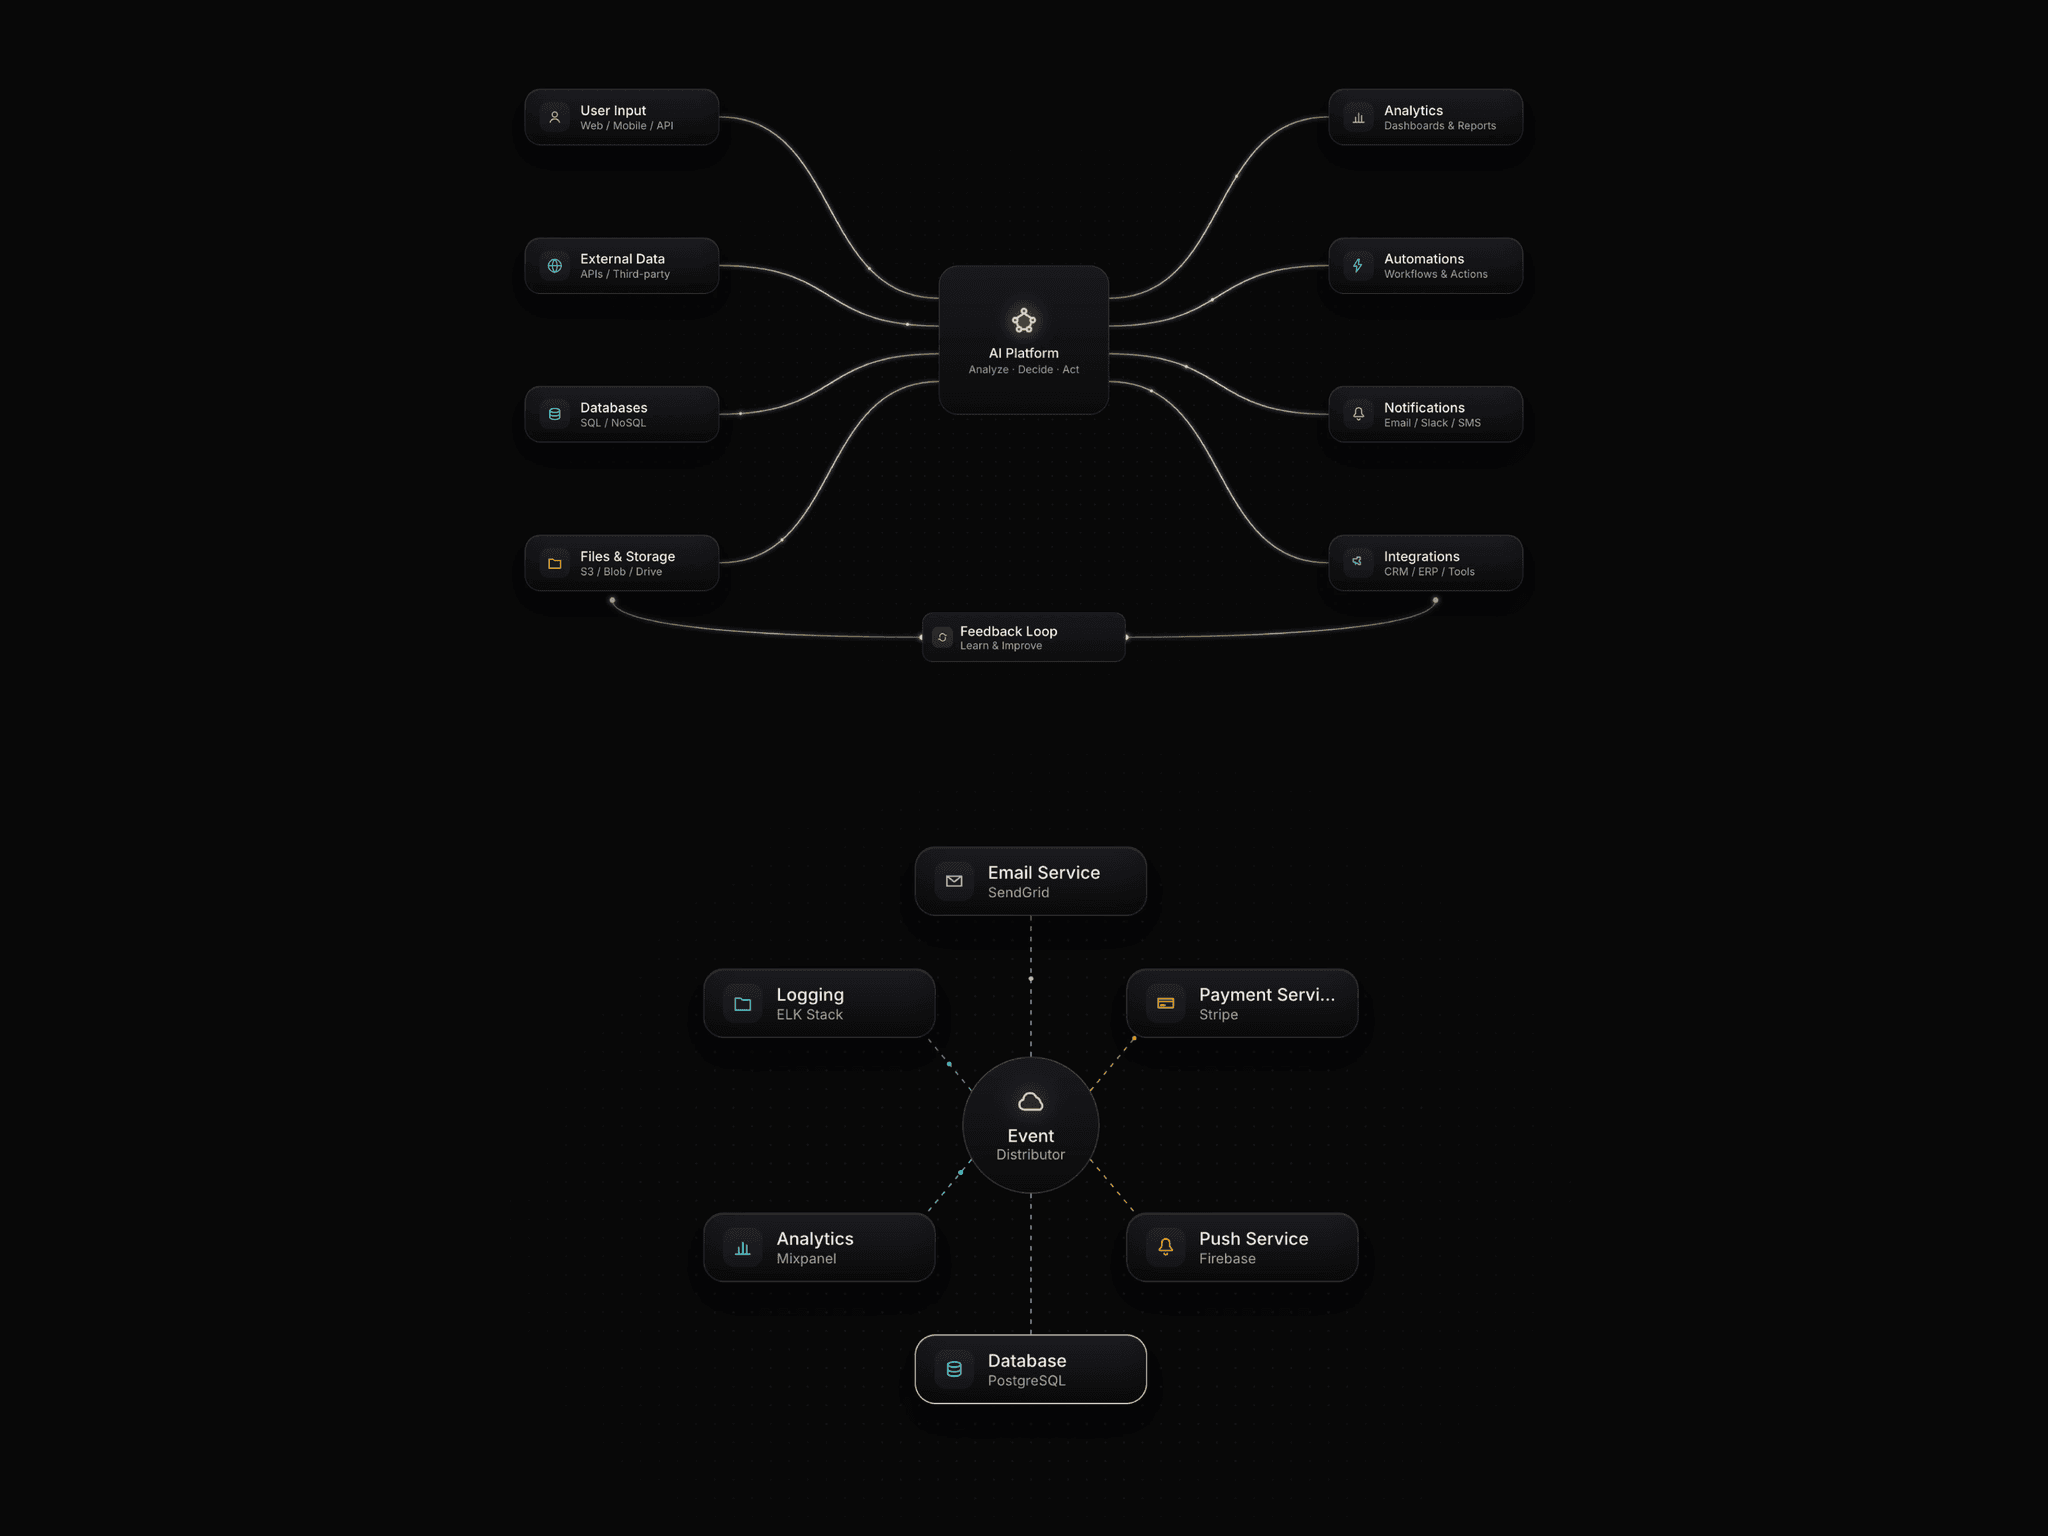
Create interactive, physics-based node layouts in Framer using your own layers as draggable nodes.This component automatically connects all nodes to a primary node, adds smooth spring motion, prevents chaotic overlap, and keeps the layout feeling alive and responsive.
It’s ideal for:
Relationship maps
Portfolio skill maps
Team / org visualizations
Site navigation experiments
Interactive storytelling
Product ecosystem diagrams
Unlike static graph layouts, this component feels playful, tactile, and alive — while still staying visually controlled.-----------------------------------------------
How It Works
The first node in your Nodes list becomes the primary / central node
Every other node connects to it automatically
Nodes can be dragged freely
When released, they settle naturally using spring-based motion
Nodes gently avoid overlapping
If dragged too far outside the frame, they glide back in
Hovering a node dims unrelated nodes and lines for better focus
-----------------------------------------------
How To Use
1. Add the component to your canvas
Drop the component into your Framer project and size the frame however you like.
2. Add your node layers
Use the Nodes property to insert your own Framer layers/components.
Each item can be:
text cards
buttons
tags
icons
mini content blocks
custom UI cards
3. Arrange node priority
The first node in the list is treated as the main node.All other nodes connect to it automatically.
4. Publish / preview
The graph will automatically initialize, settle into place, and become interactive.
-----------------------------------------------
Included Interactions
Draggable Nodes
Users can click and drag any node freely.
Physics-Based Motion
Nodes move with soft spring behavior for a natural, fluid feel.
Smart Collision Spacing
Nodes resist getting too close and gently push apart.
Hover Focus
Hovering over a node:
keeps the hovered node fully visible
keeps the primary node fully visible
keeps the connecting line visible
dims unrelated nodes and lines
Soft Boundary Behavior
Nodes can visually move beyond the frame edge, but they are gently pulled back in instead of getting harshly clipped.
-----------------------------------------------
Customizable Properties
Nodes
Add and reorder your custom node layers.
Background Color
Sets the background of the graph container.
Line Color
Controls the connector line color.
Line Opacity
Adjusts how visible the connector lines are.
Line Width
Controls connector stroke thickness.
Dim Opacity
Controls how faded non-hovered nodes/lines become on hover.
Spring Length
Controls how far nodes tend to sit from the primary node.
Spring Strength
Controls how tightly the graph holds together.
Damping
Controls how quickly motion settles after movement.
-----------------------------------------------
Best Practices
Use consistent card sizes for a cleaner visual rhythm
Keep the primary node visually stronger than the rest
Works best with 4–12 nodes
Leave enough empty space around the graph for motion
Use hover dimming to create guided exploration
-----------------------------------------------
Good Use Cases
This component works especially well for:
About pages
skills, tools, strengths, roles
Portfolio case studies
process maps, systems, frameworks
Startup / product sites
ecosystem or feature relationships
Interactive storytelling
concepts, themes, character maps
Navigation experiments
playful sitemap-style interfaces
-----------------------------------------------
Notes
This component is designed for interaction-first layouts, not strict data visualization
Node positions are physics-driven, so layouts will feel organic rather than rigid
Best used when you want a graph that feels alive, not mechanical