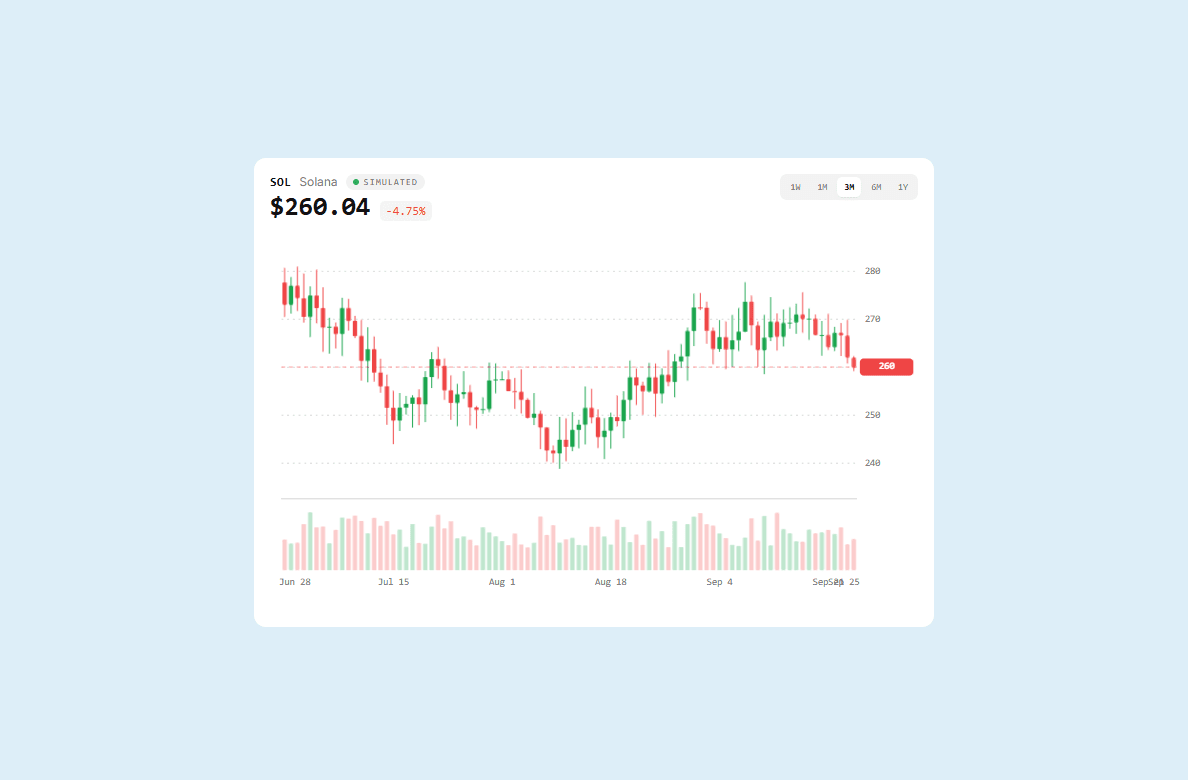
About Market Chart
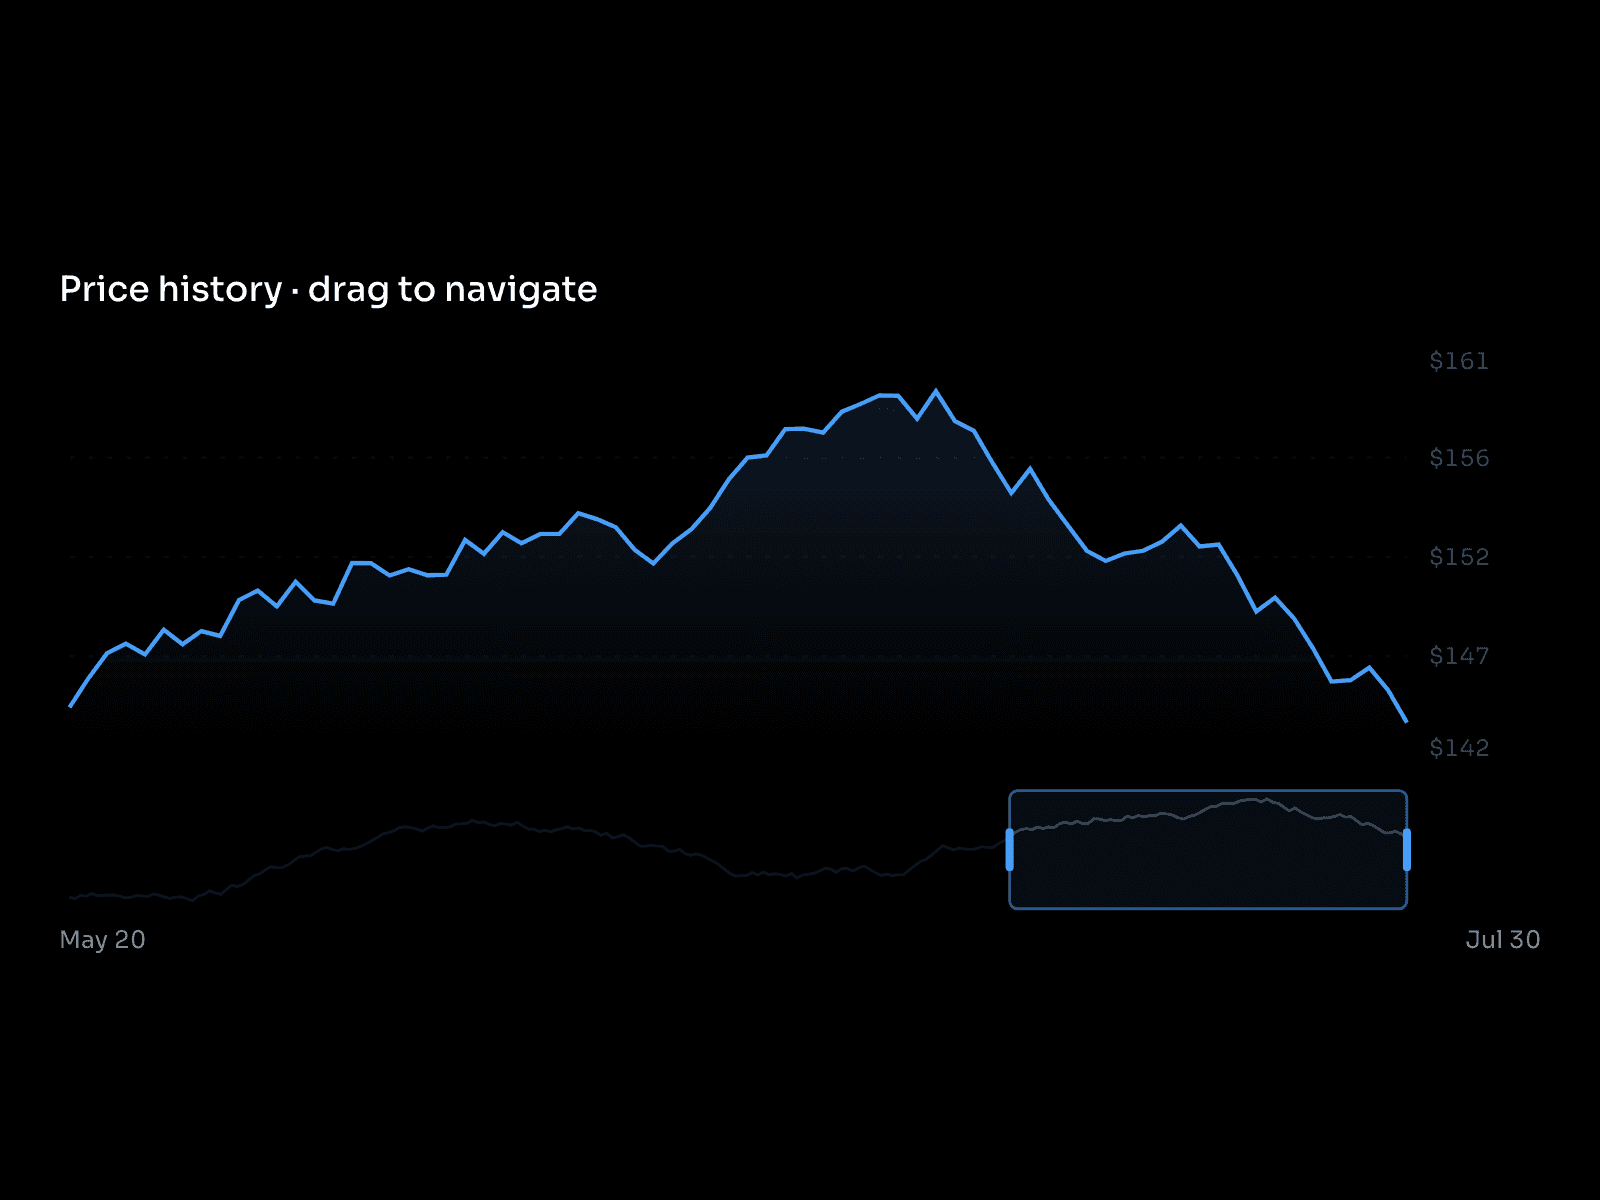
A polished, responsive market chart component for Framer with interactive candlesticks, smooth area charts, volume visualization, range switching, crosshair inspection, and simulated live market movement.
Designed for modern fintech, crypto, SaaS, analytics, trading, dashboard, and financial website designs.
Preview
Great for
Fintech and financial websites
Crypto and Web3 landing pages
Trading dashboards
Investment and portfolio interfaces
SaaS analytics dashboards
Stock and market data presentations
Product showcases
Data visualization sections
Interactive Framer prototypes
Modern dark or light interface designs
Features
Responsive SVG-based chart
Candlestick chart mode
Smooth area chart mode
SOL, AAPL, and BTC demo datasets
1W, 1M, 3M, 6M, and 1Y ranges
Interactive range selector
Simulated live market stream
Volume bars
Current-price line and price badge
Interactive crosshair
OHLCV hover information
Keyboard chart navigation
Bullish and bearish colors
Optional hollow bullish candles
Adjustable candle opacity
Compact price formatting
Custom colors
Adjustable chart height
Adjustable price typography
Custom border radius
Grid visibility control
Tooltip visibility control
Animation controls
Reduced-motion support
Static-renderer support
Responsive layout for different Framer frame sizes
Support
Need help using or customizing the component?
Contact me at karimsaif010@gmail.com
Follow me on X for new Framer components, templates, experiments, and updates: