About Ranking Race
Ranking Race turns a pasted spreadsheet table into a bump chart or a bar chart race, for year-in-review pages and benchmark histories.
Features
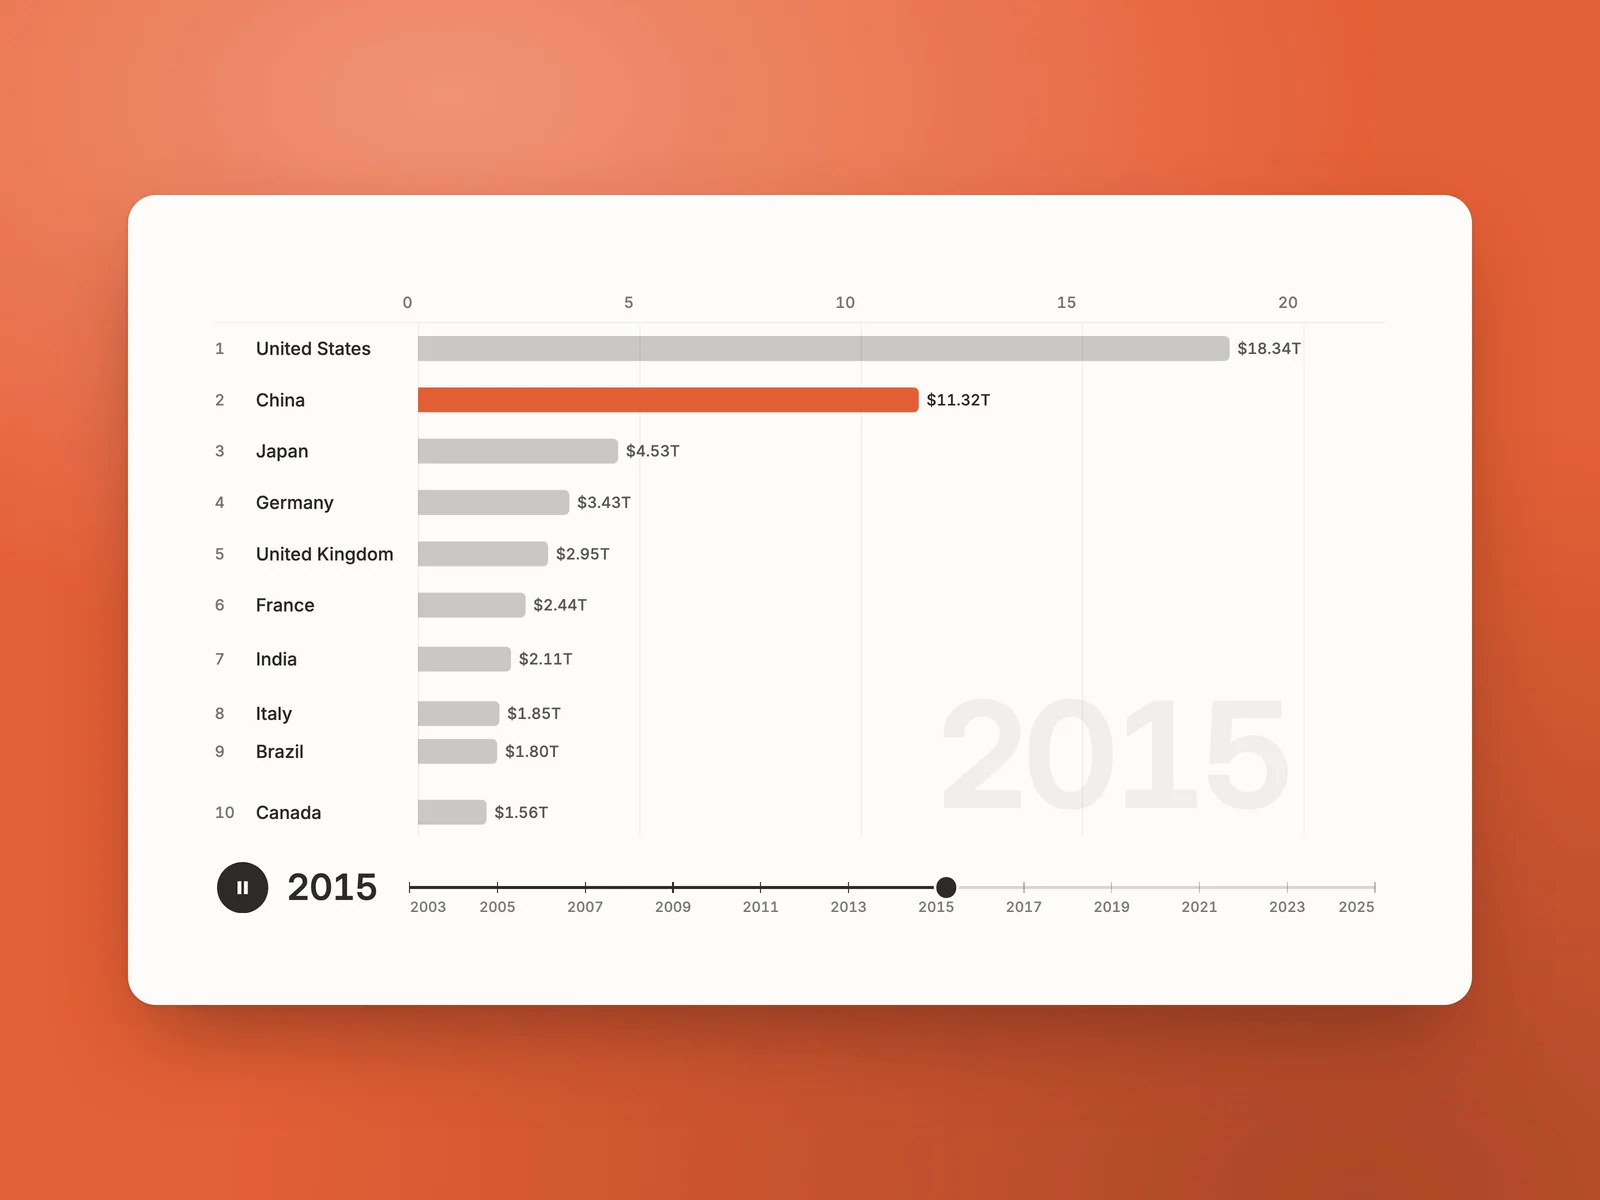
Bar race: bars that overtake each other, with play and scrubber
Bump chart: final standings with ranks gained or lost since the start
Spreadsheet paste: items in rows, in columns or as a list
Up to three highlights: own colors, the rest stays quiet
Mobile: fewer periods on phones instead of squeezed lines
Accessible: data table for screen readers, keyboard slider, reduced motion
Customization
Five groups in the Property Panel:
Data: Table, Layout, Numbers (1,234.5 or 1.234,5), Rank by, Rows, Summary
View: Bump or Race, Draw in, Autoplay, Duration, Big year, Play, Pause and Slider labels
Highlight: Items, Color 1 to 3
Values: Prefix, Suffix, Compact (48.2K)
Style: Surface and Ink colors, Labels and Figures fonts
Use Cases
Agencies: year-in-review pages for clients
SaaS marketing: market share and benchmark histories
Sports sites: league places across a season
Newsrooms: countries or brands ranked over time
Demo data: GDP in current US dollars, World Bank, CC BY 4.0.
Updates and Support
Free updates. Email support at support@koja-studios.de, usually 1 to 2 business days.
Refunds: If the component doesn't work as described and we can't fix it, email support@koja-studios.de within 14 days of purchase and we'll refund you in full. This doesn't affect your statutory rights.
License
Unlimited personal and commercial use, including client work. No resale or redistribution. Full terms: https://koja-studios.de/legal/license