About Quor Charts
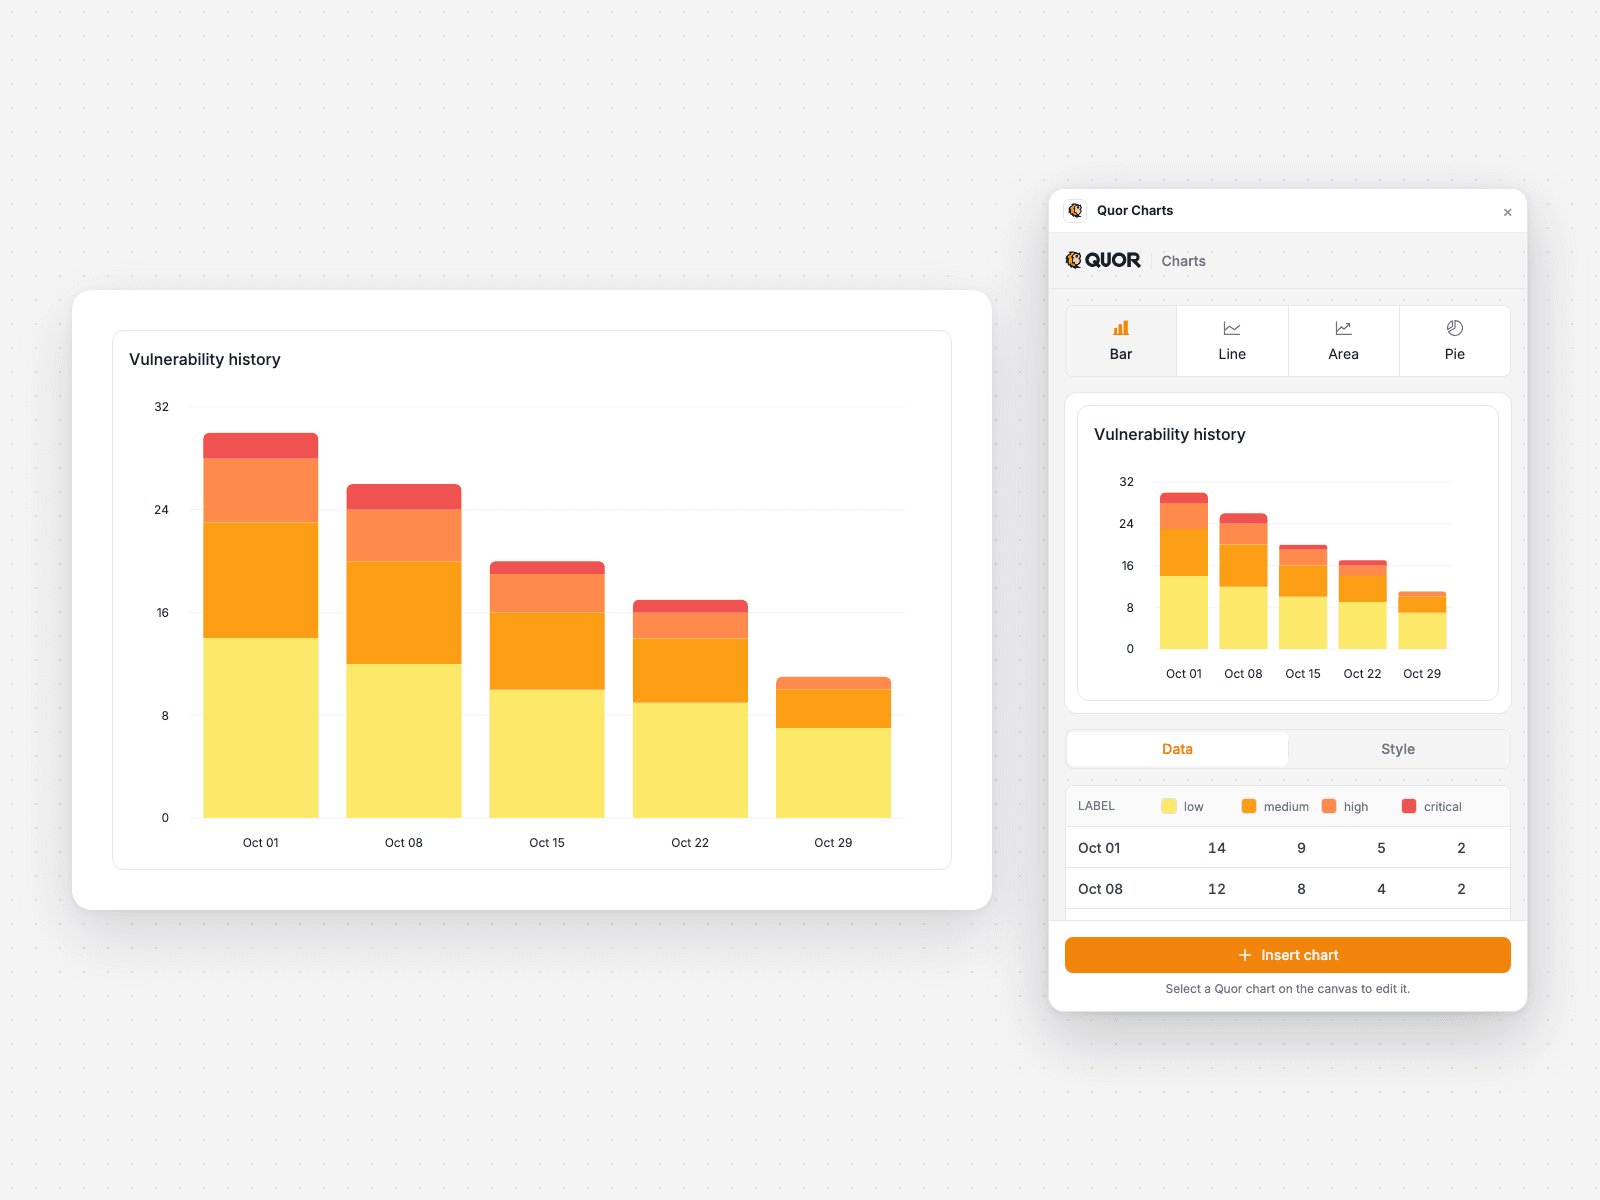
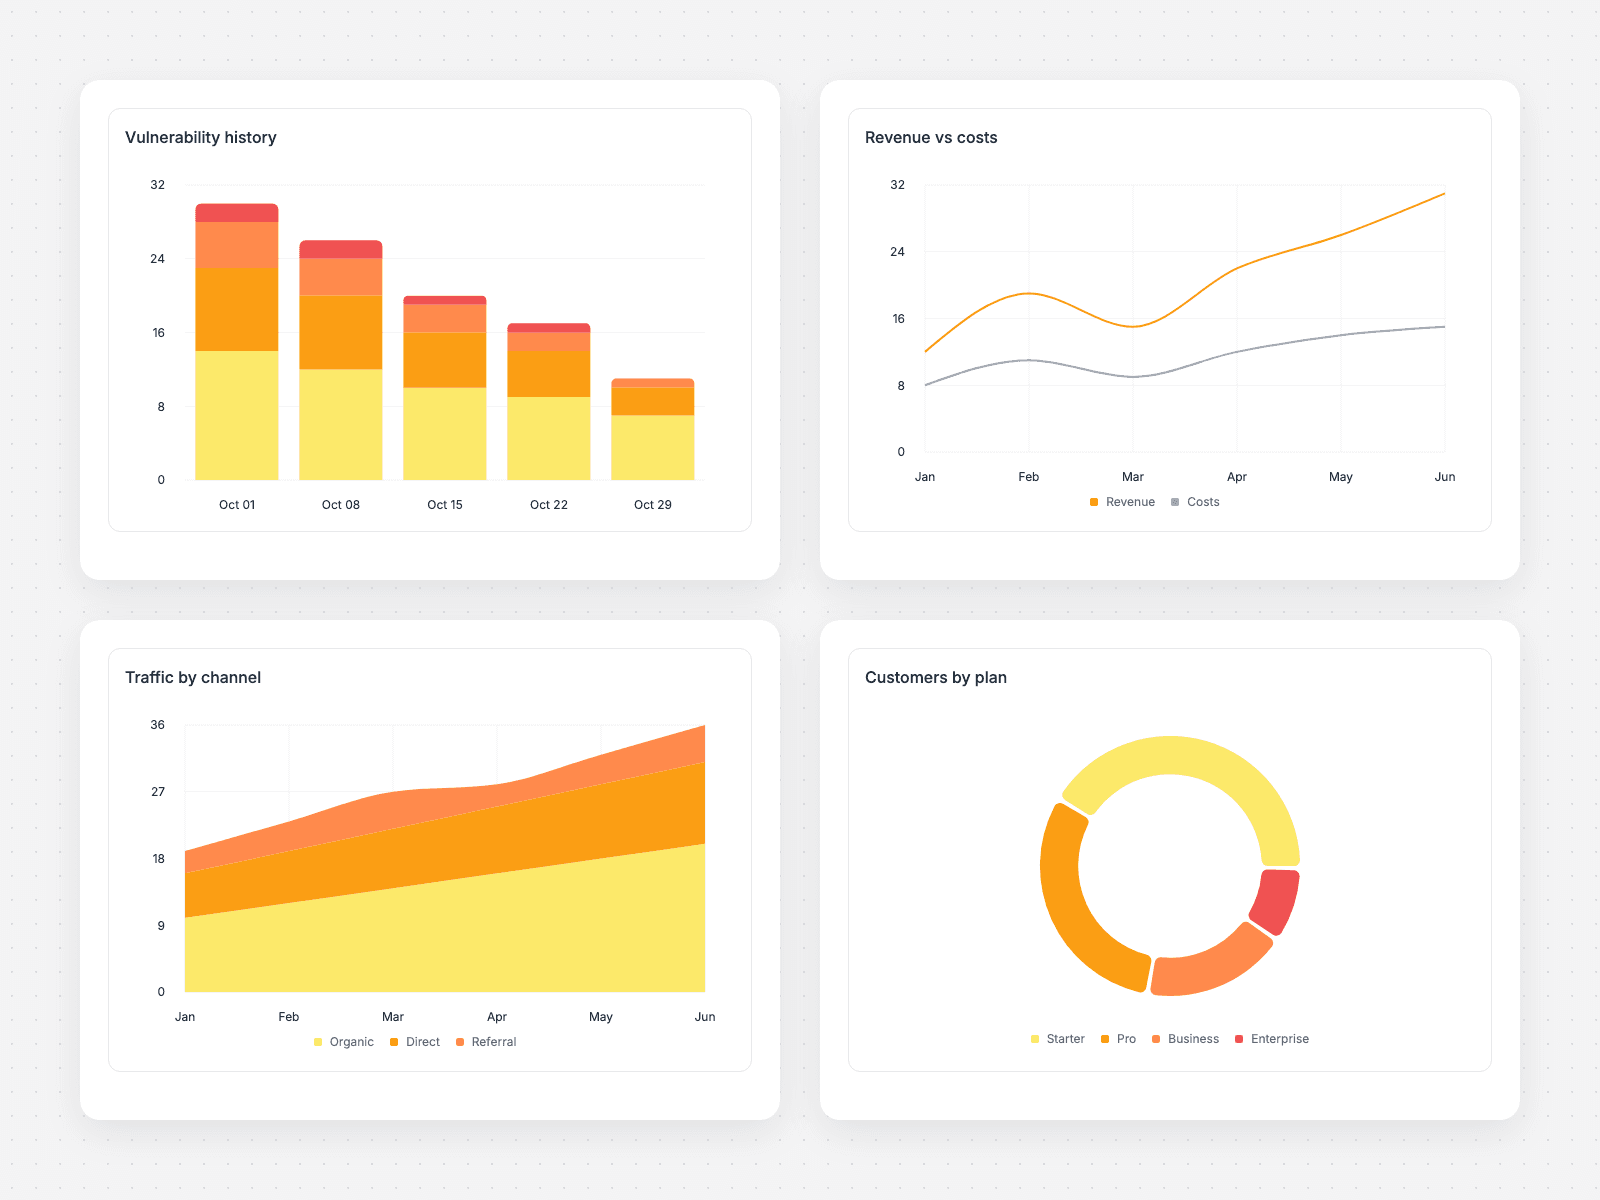
Add bar, line, area and pie charts to your Framer project in a few clicks. Pick a chart type, enter your data, and insert it on the canvas as a live, responsive component with tooltips and animations.
Bring your data your way
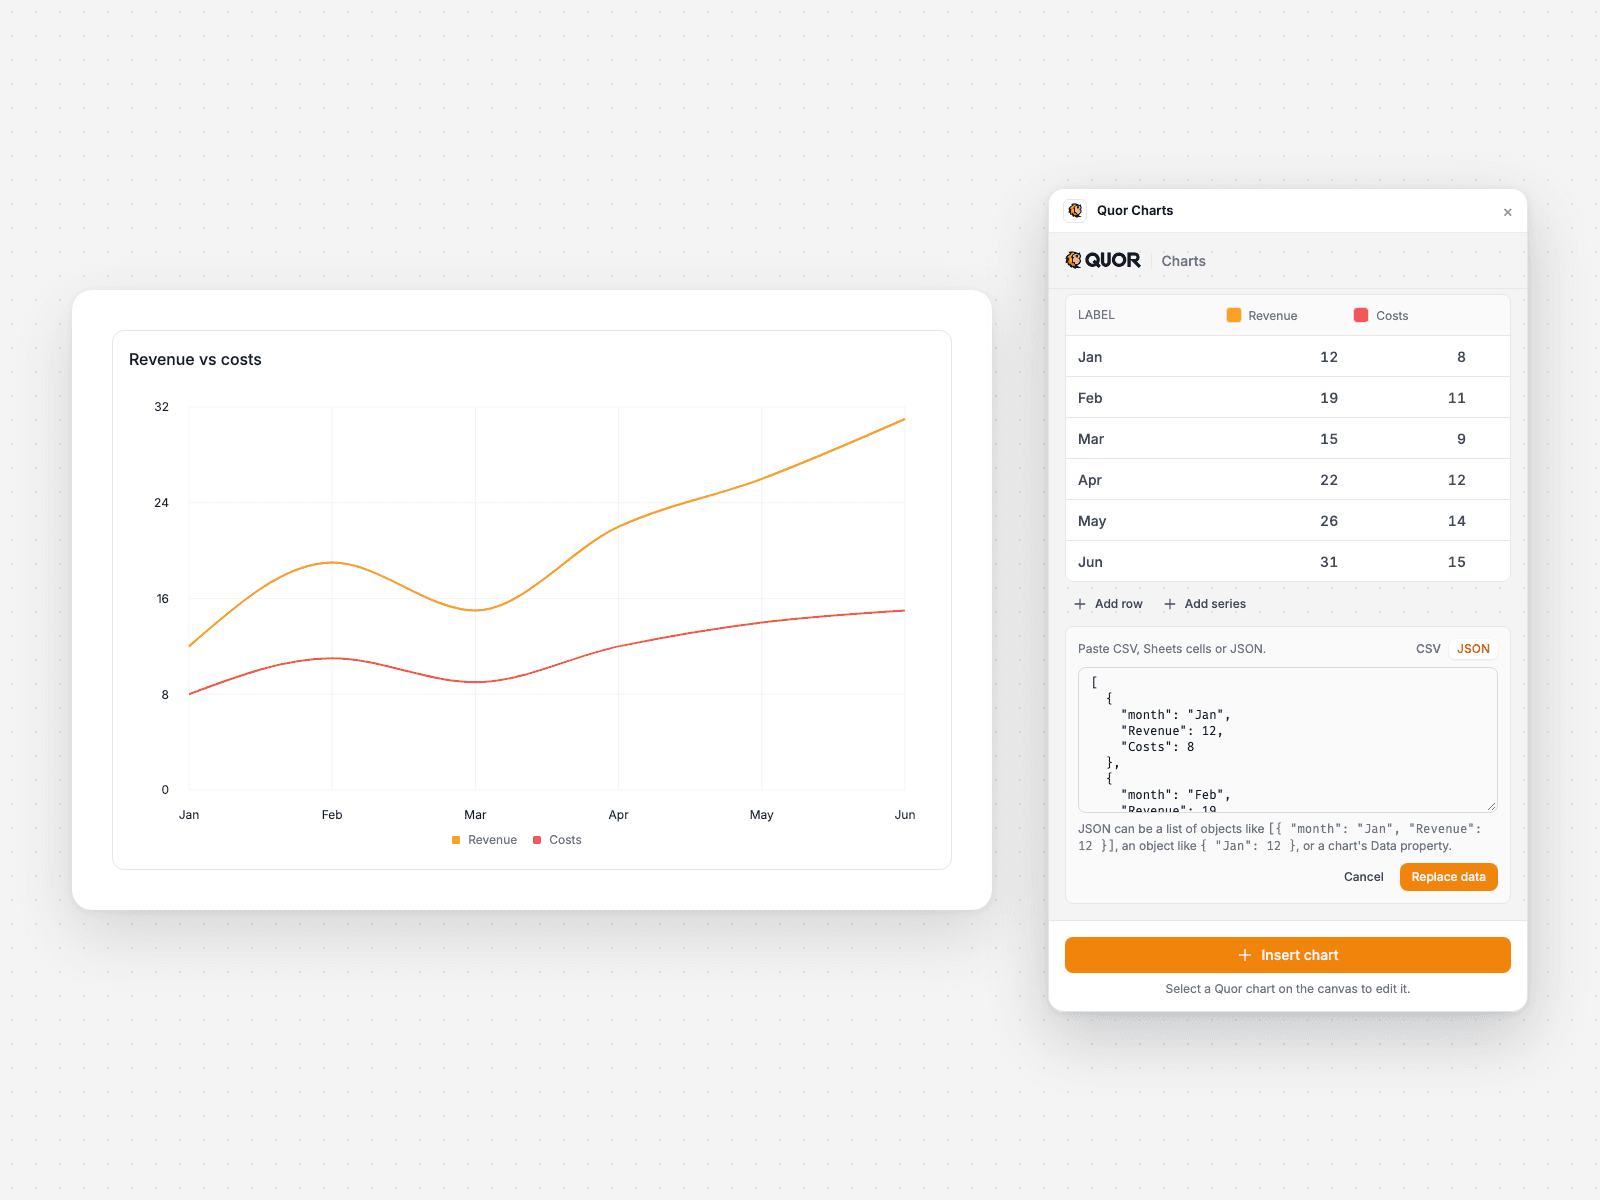
Edit data in a spreadsheet-style table: add rows and series, rename them, pick colors.
Paste CSV, cells copied from Google Sheets or Excel, or JSON (lists of objects, label/value maps, or Chart.js data). The format is detected automatically.
Style it to fit
Stacked or side-by-side bars, donut or full pie.
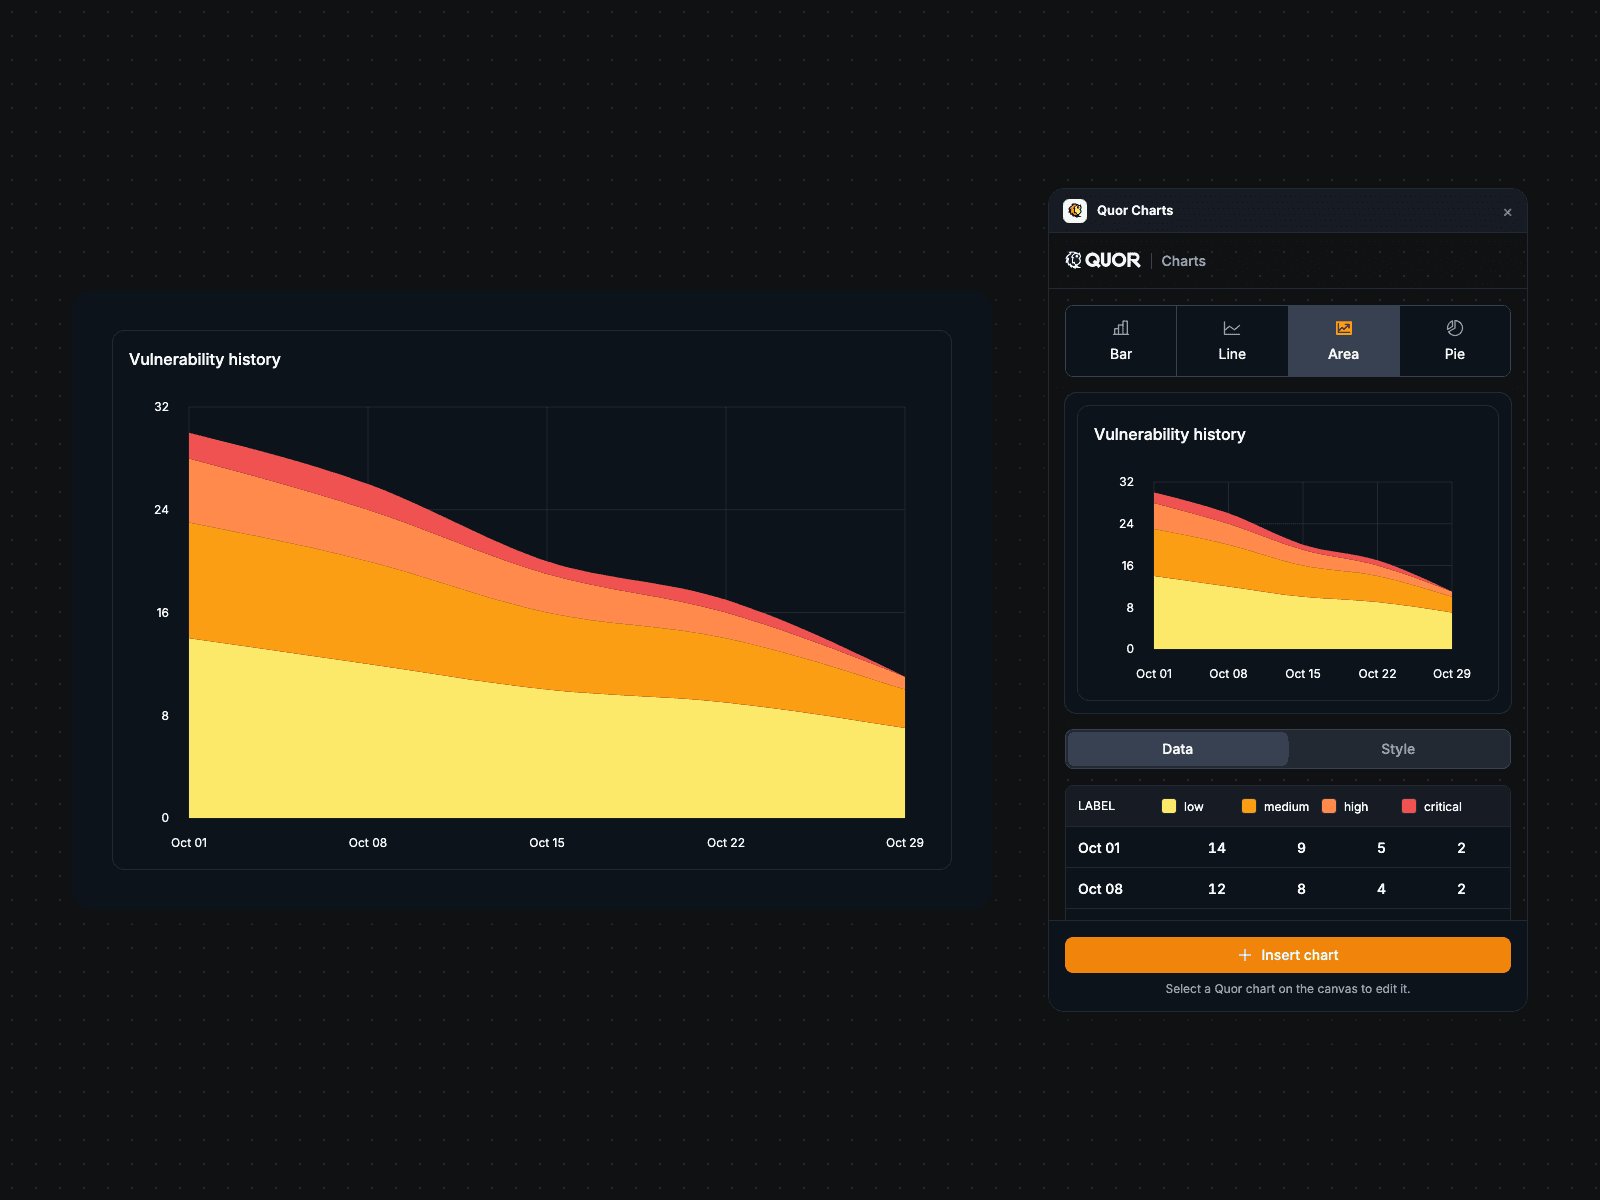
Optional title and card (outline or filled), light or dark theme.
Toggle grid lines, legend, tooltips and animation.
Edit anytime
Select a chart on the canvas to load it back into the plugin, change it, and click Update.
Every chart is a regular code component in your project, so its data and style can also be edited from Framer's properties panel, without the plugin.
Charts keep working on your published site.
Good to know
Charts are built with Recharts (MIT license), bundled into the chart code, so nothing loads from a CDN.
Charts use the Inter font when your site loads it, and fall back to the system font otherwise.
Free to use.