About Sightline
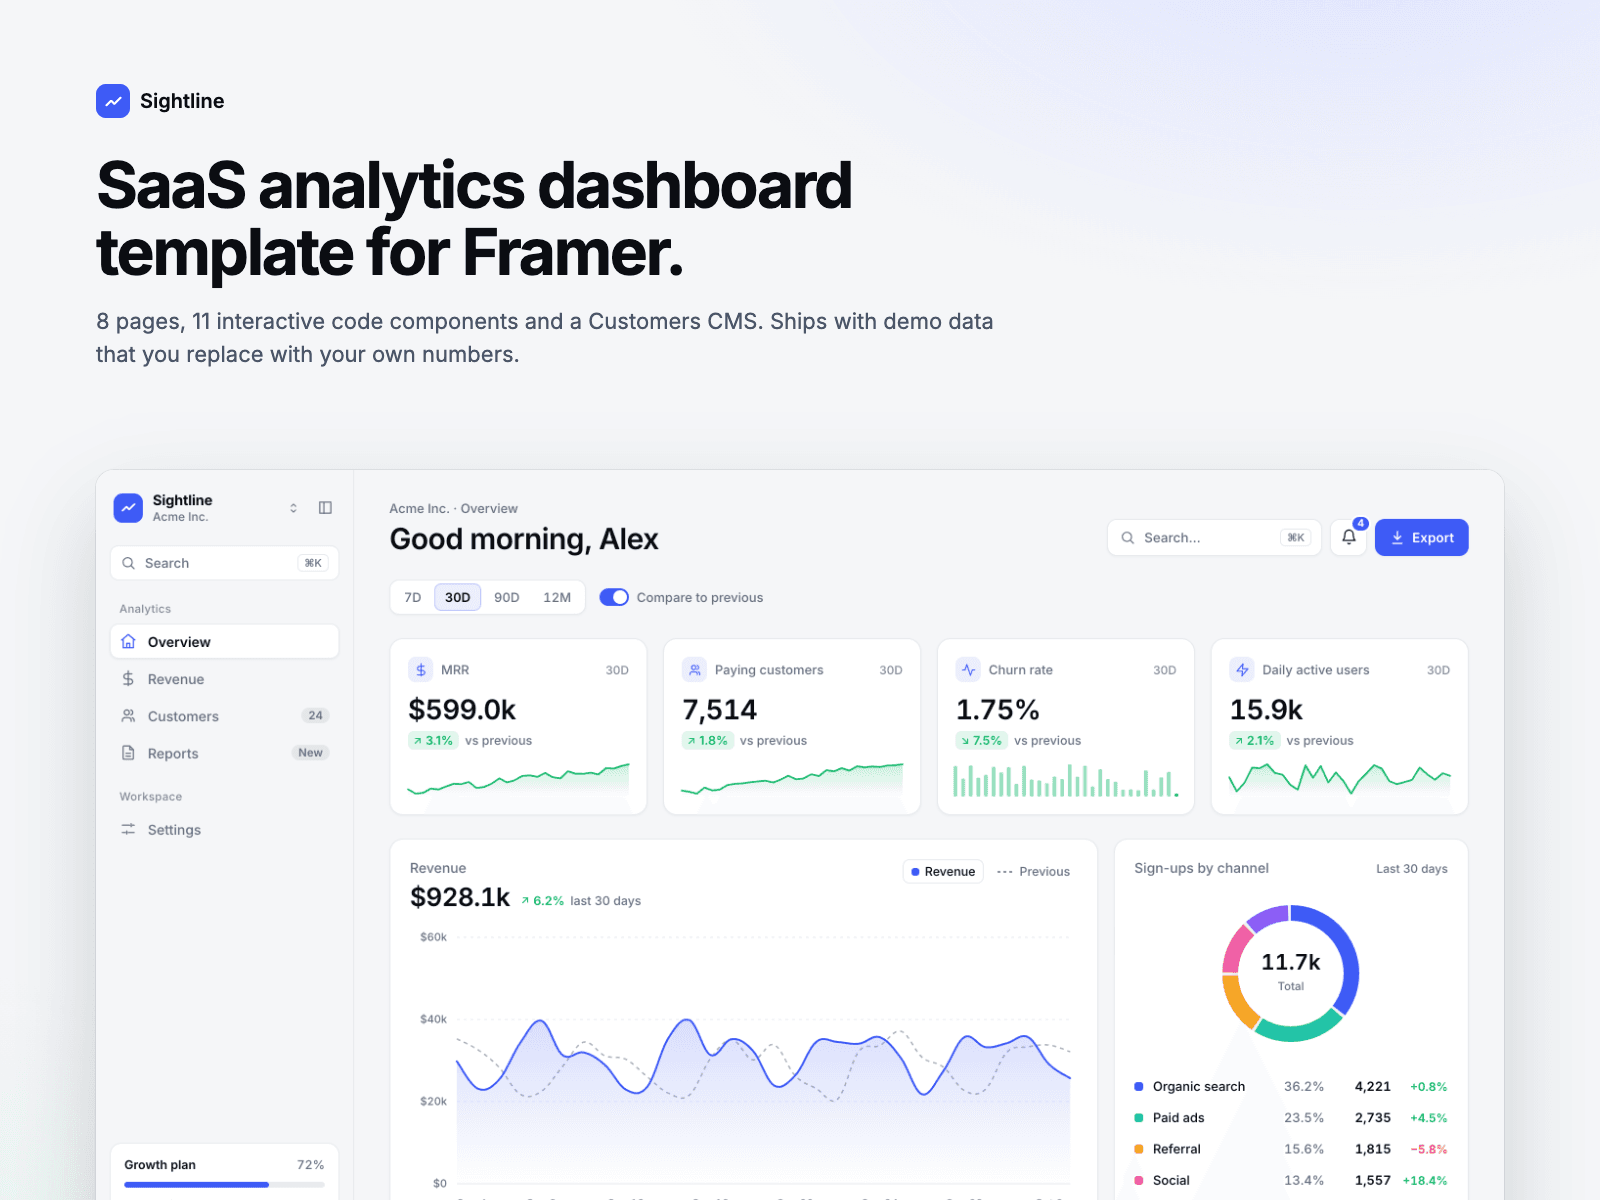
Sightline is a SaaS analytics dashboard template: 8 pages, 11 interactive code components and a Customers CMS. Everything on the preview is clickable.
Pages
Overview: KPIs, revenue chart, channel donut, customers table, live activity feed
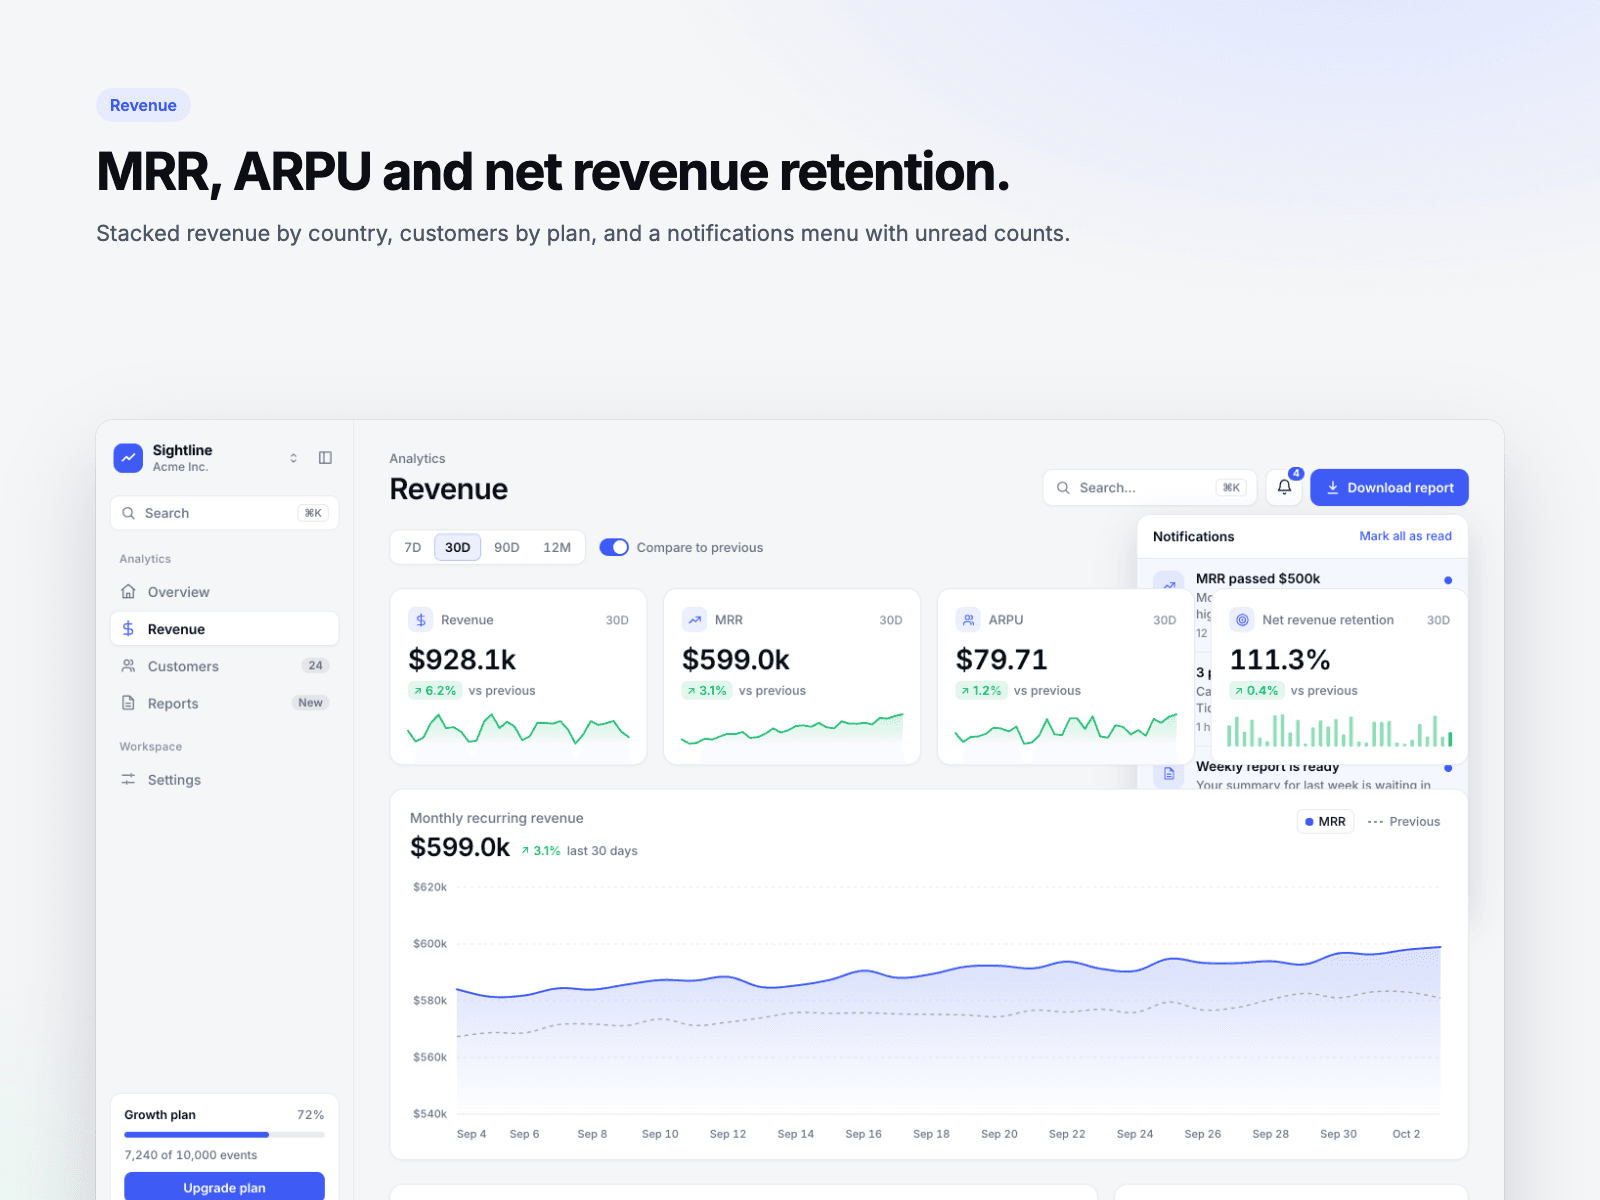
Revenue: MRR, ARPU, net revenue retention, revenue by country, invoices
Customers: searchable table linked to a CMS profile page per customer
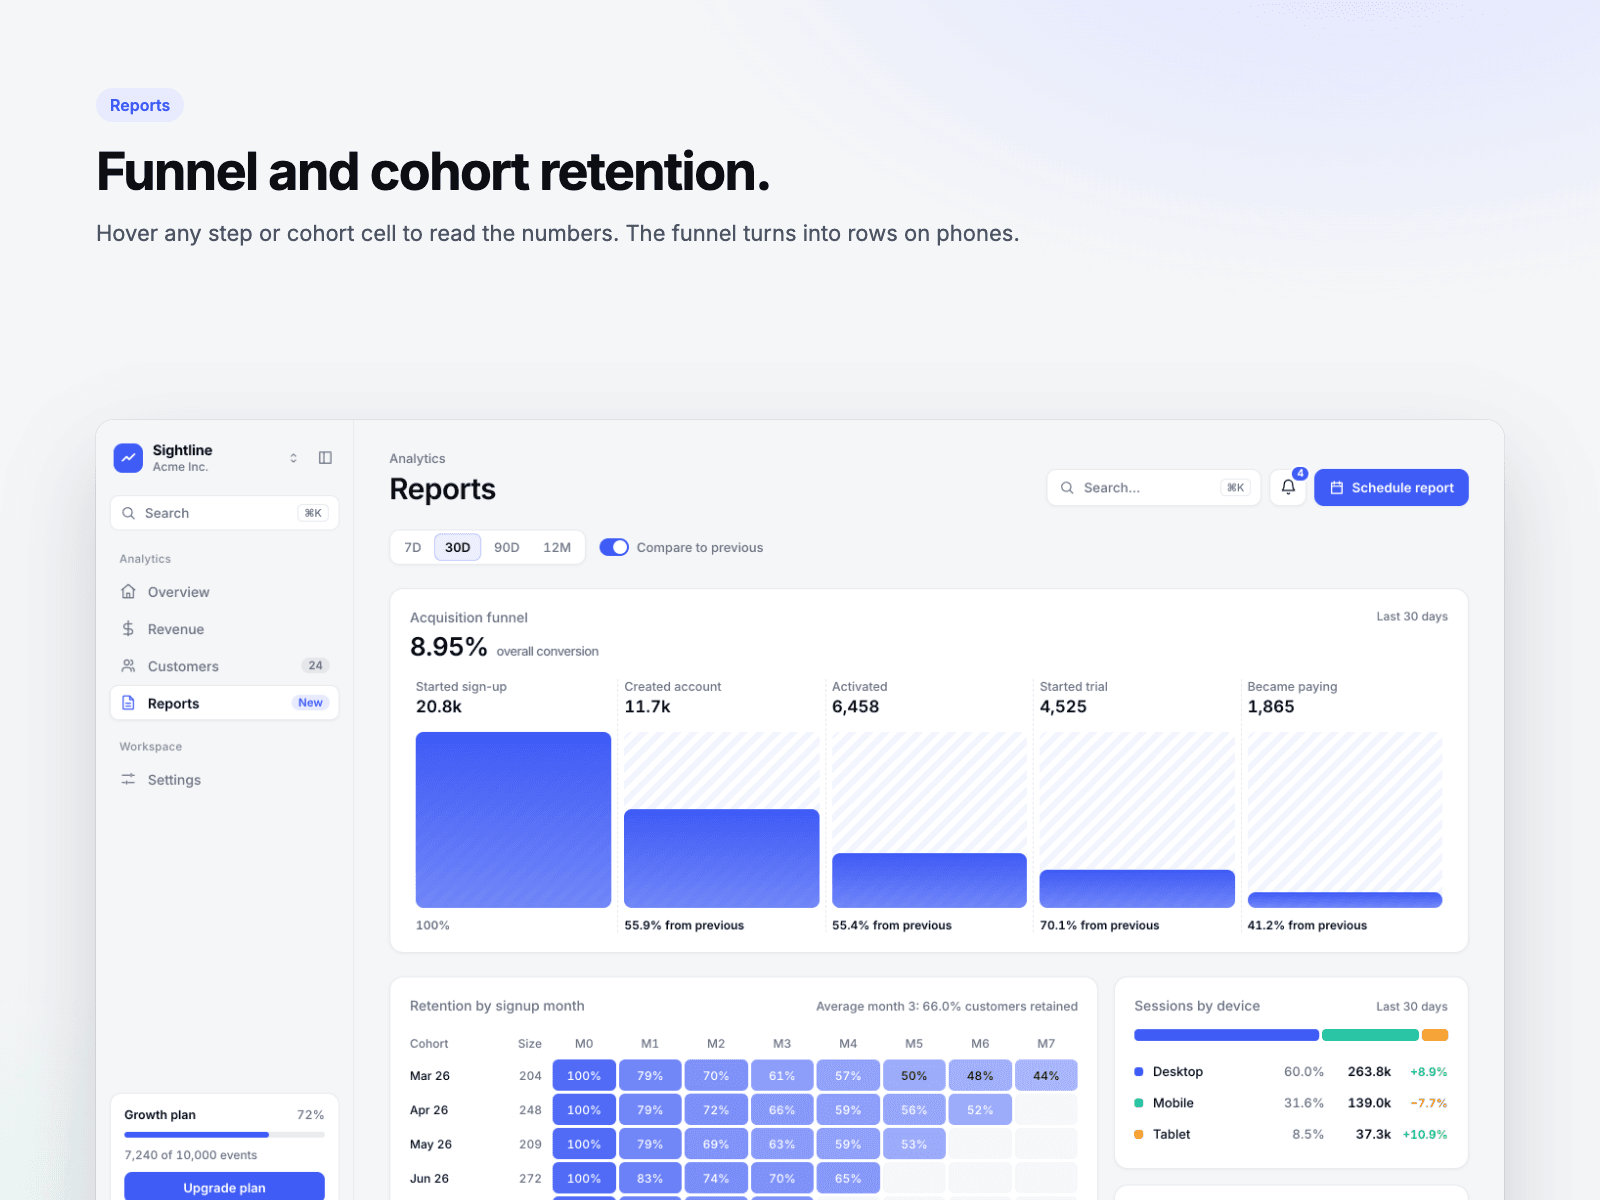
Reports: acquisition funnel, cohort retention heatmap, traffic breakdowns
Settings, Sign in and 404
Interactive components
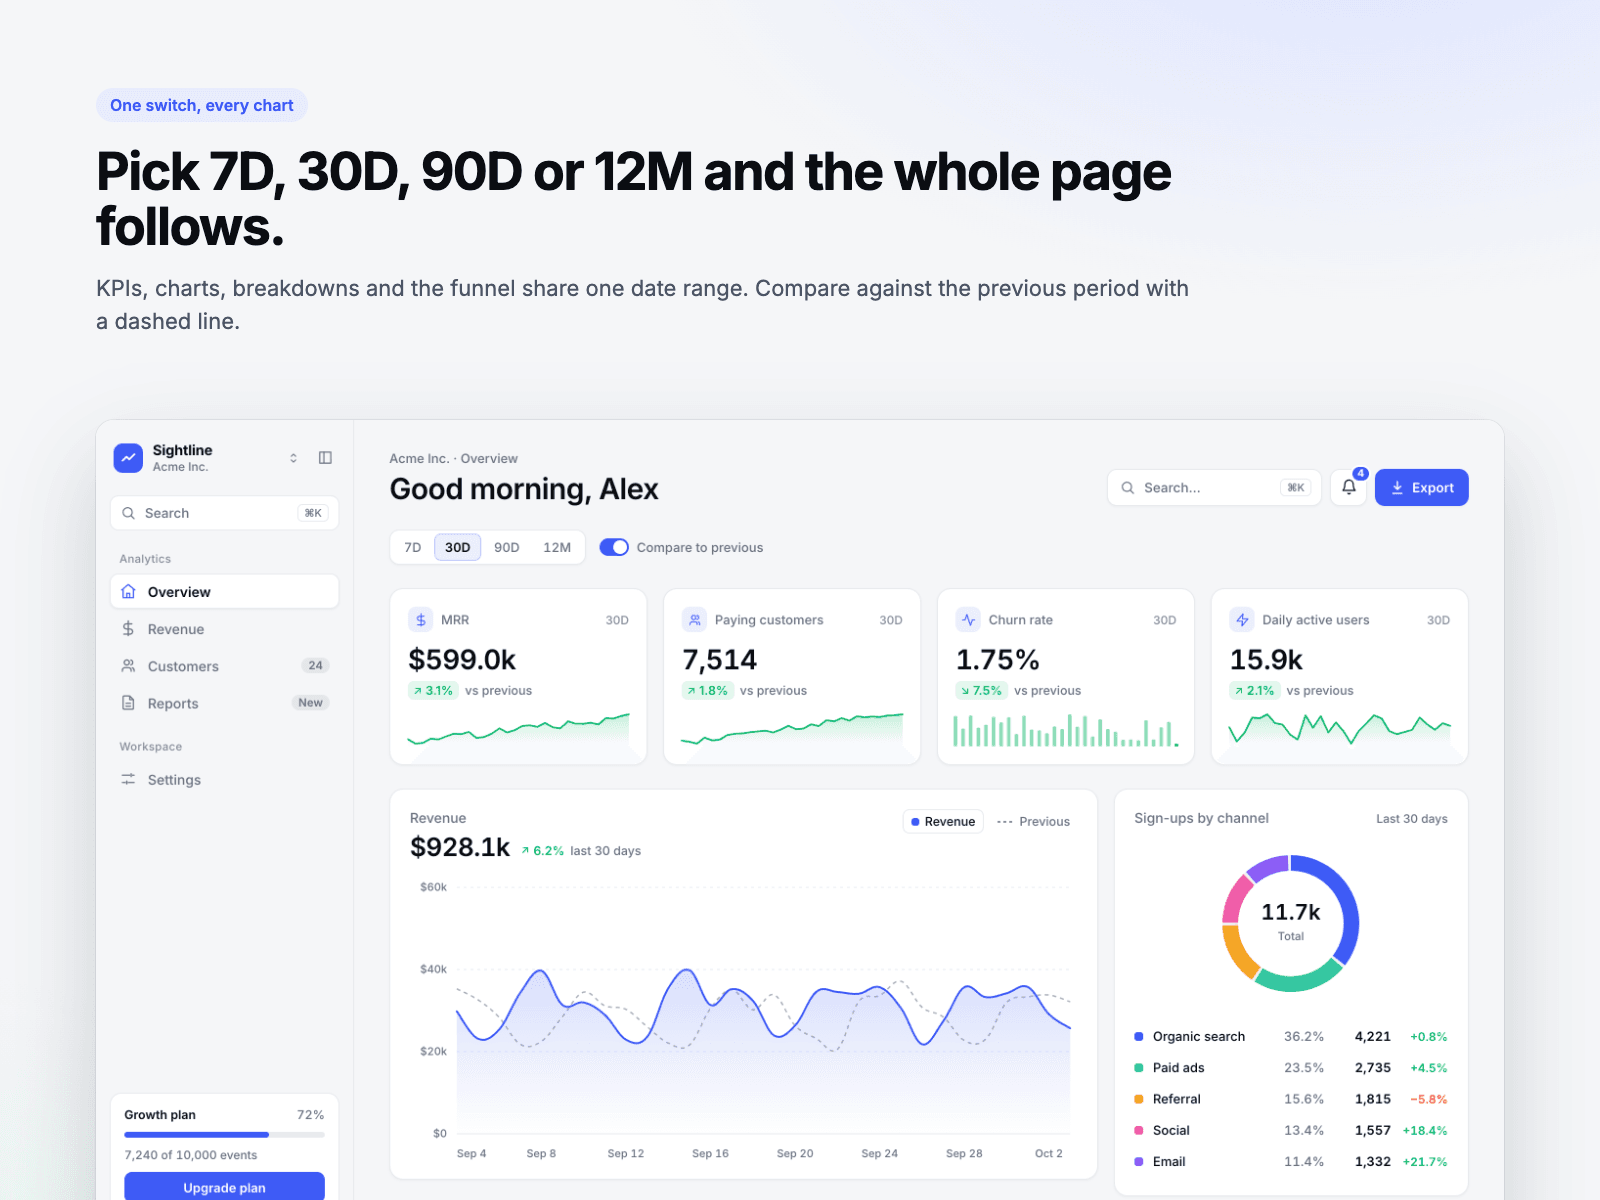
Date range switch (7D, 30D, 90D, 12M) and a previous-period toggle that every chart and KPI on the page follows
Area, line and bar charts (stacked or grouped) with tooltips and legend toggles
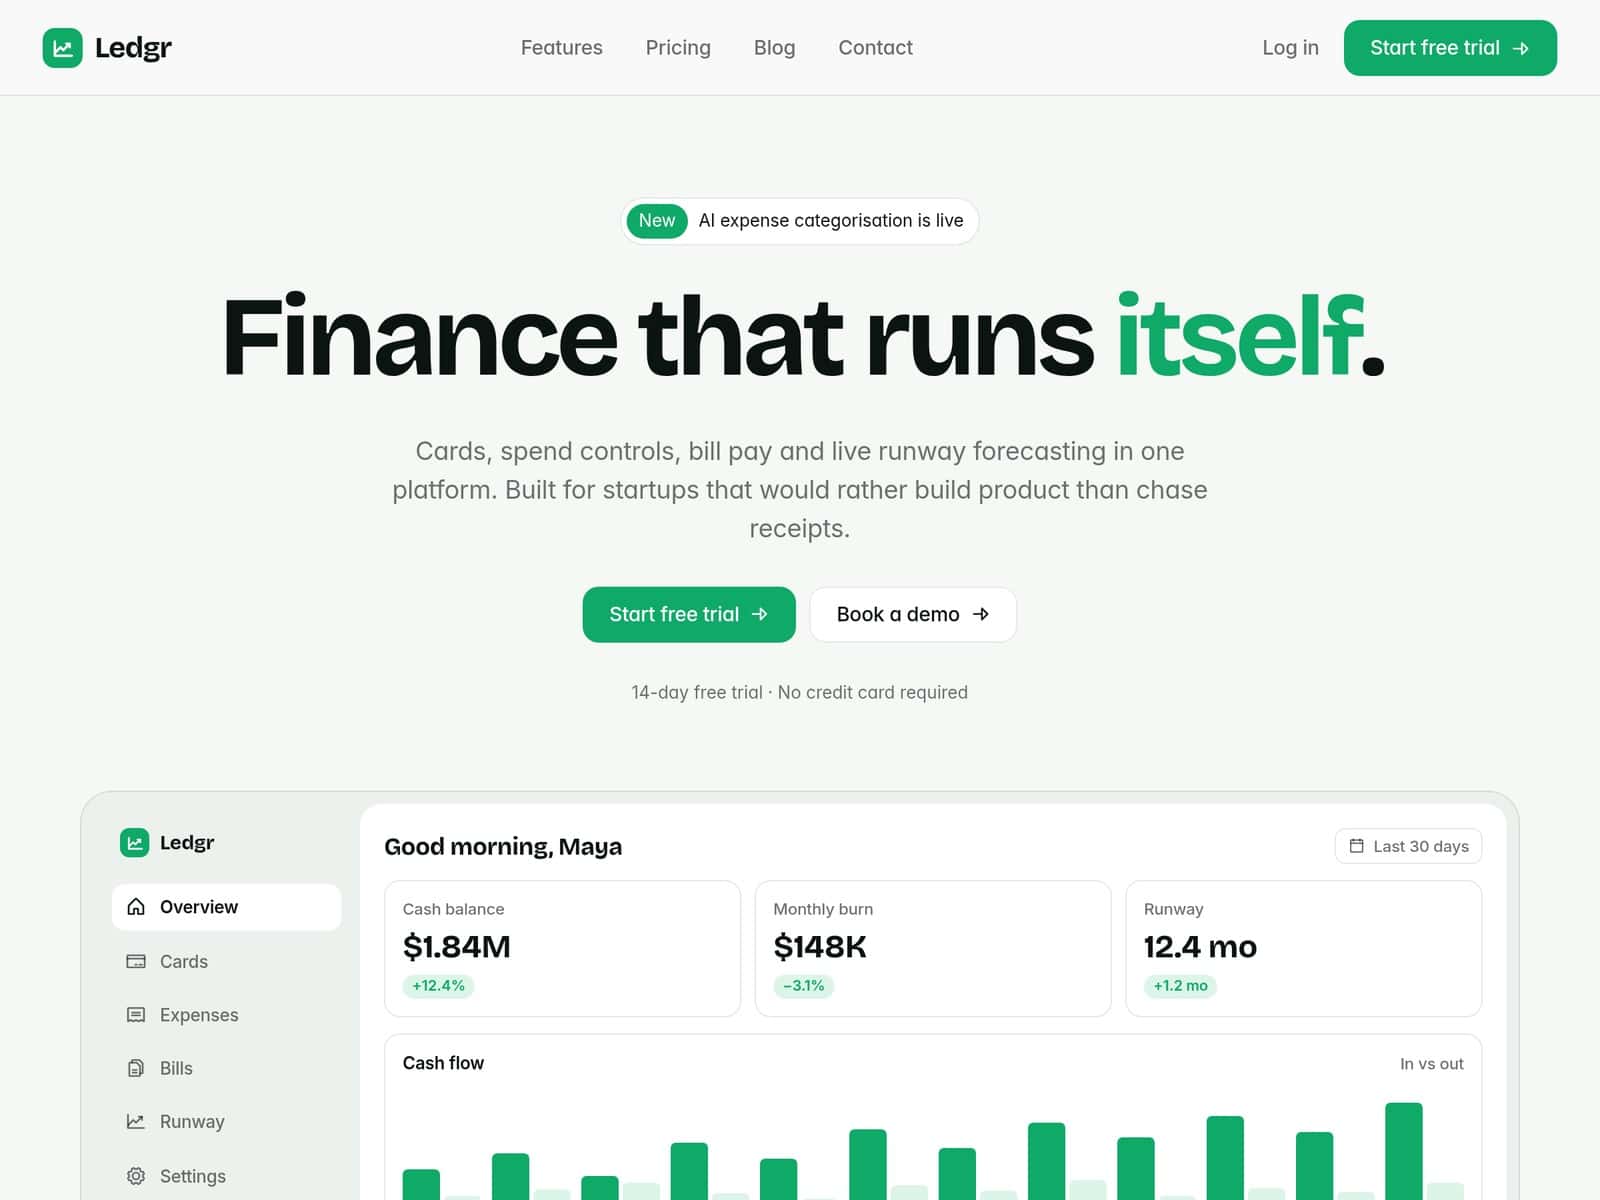
KPI cards with sparklines, donut / bars / meter breakdowns, funnel and cohort heatmap
Table with search, status filters, sorting, pagination, row selection and CSV export
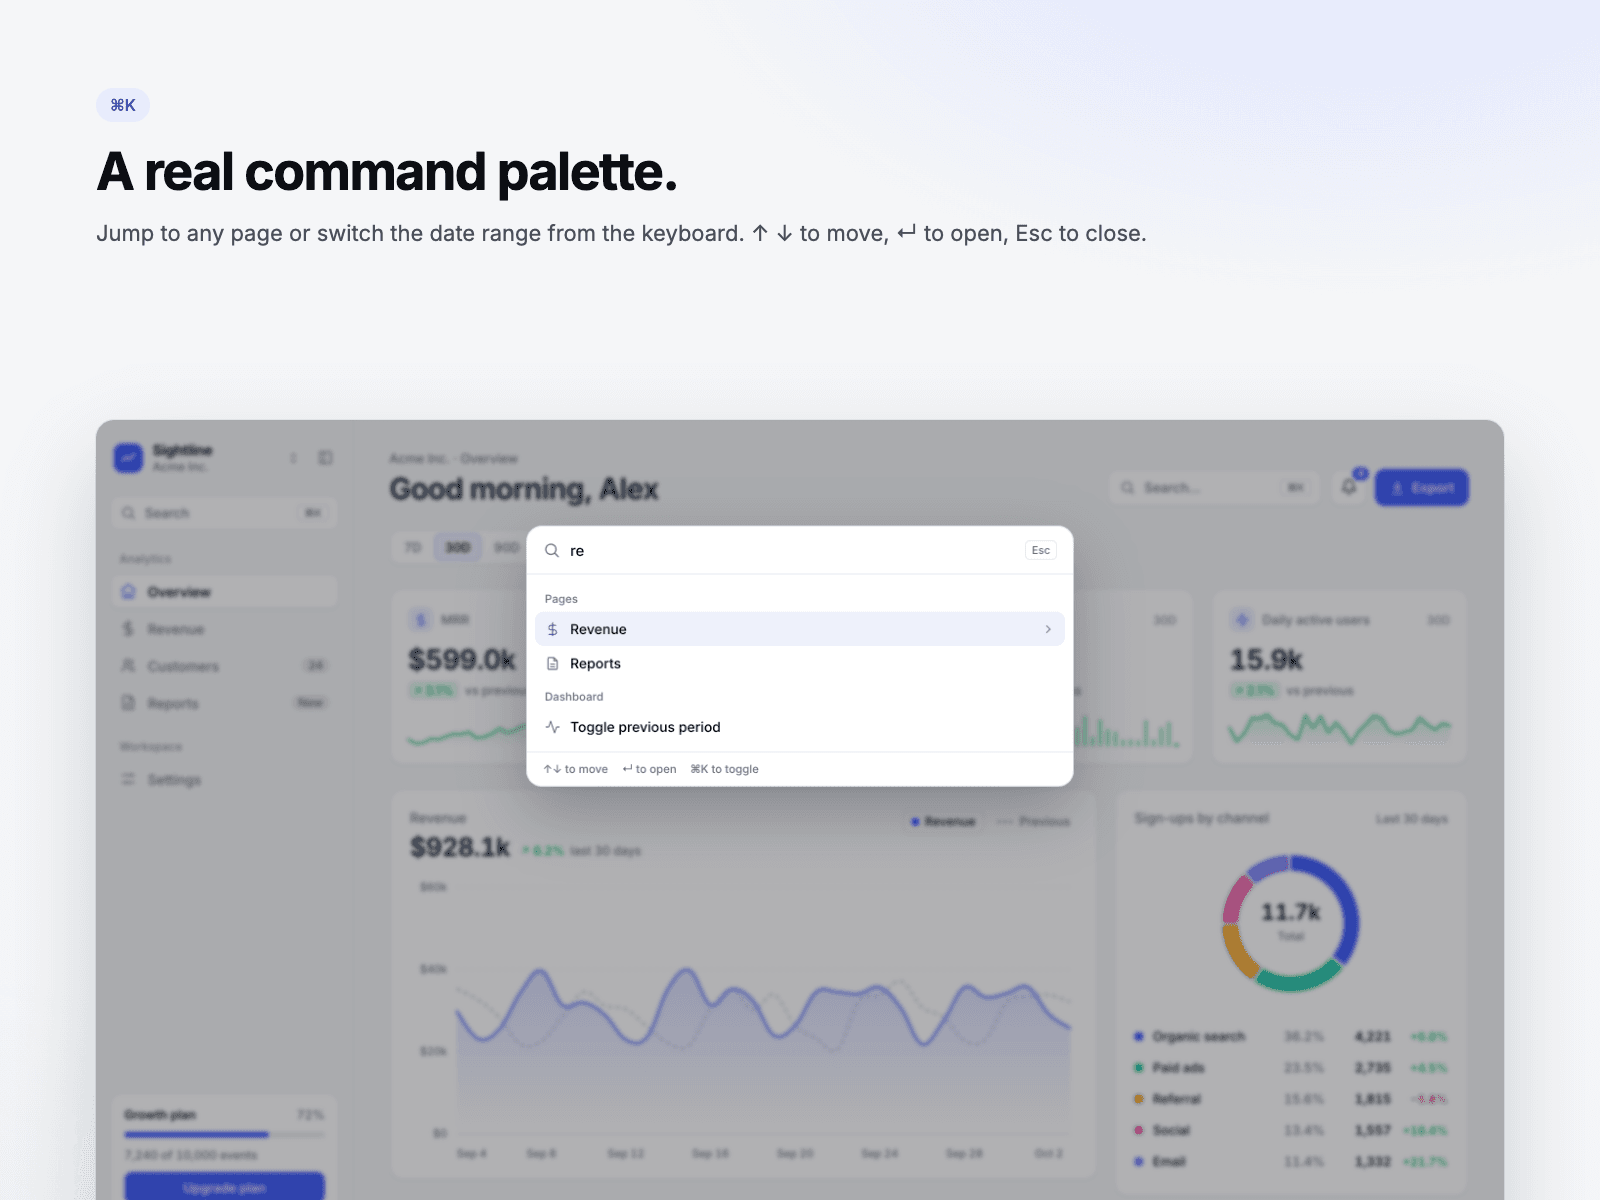
Sidebar with a ⌘K command palette and collapse button; a top bar with a slide-in menu on phones
Notifications dropdown and a live activity feed
Good to know
Ships with generated demo data. It does not connect to a database or analytics service on its own. You can paste your own numbers into charts, KPIs, breakdowns and the funnel.
9 colour styles: change Accent once and the whole dashboard follows.
Desktop, tablet and phone layouts.