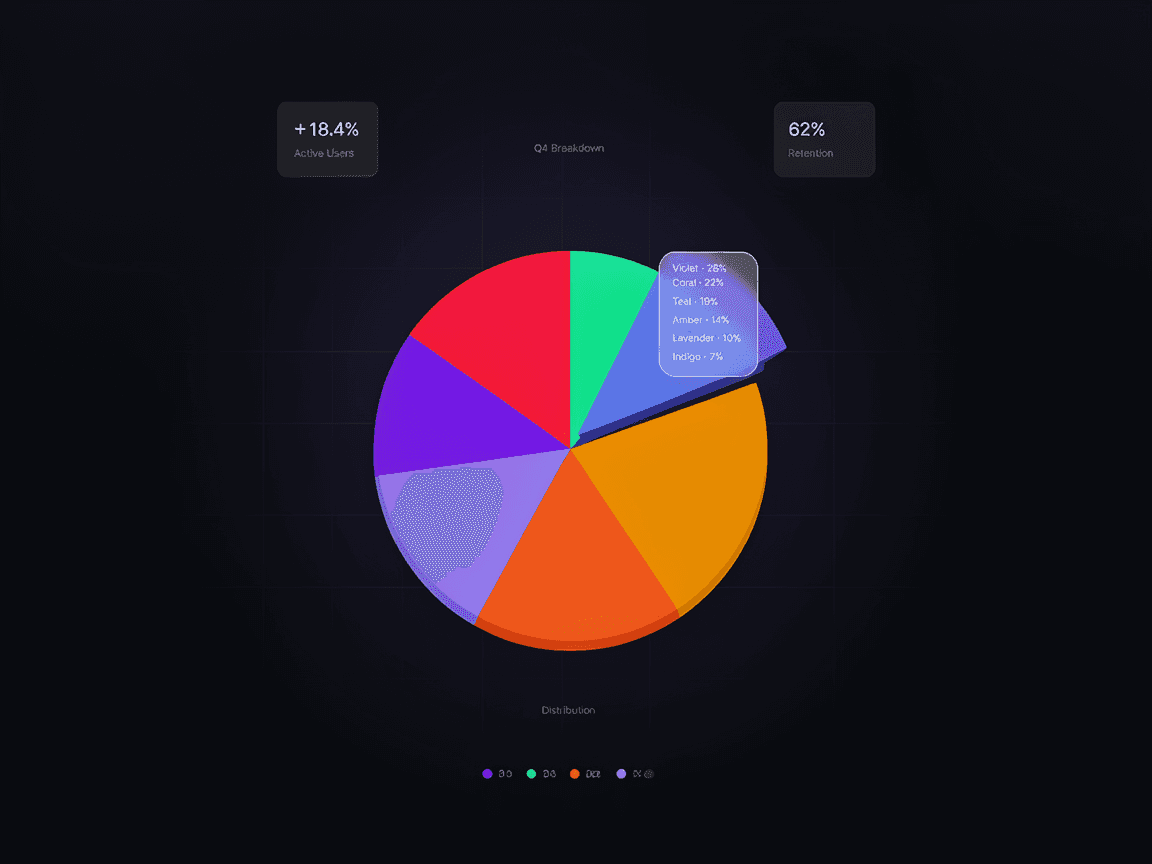
About Bar Graph
Bring your data to life with a sleek, interactive Bar Graph for Framer. This component makes it easy to visualize metrics with smooth animations and fully customizable bars, colors, and labels. Perfect for dashboards, reports, and product pages that need clear, engaging data presentation.
As the graph renders, bars animate dynamically to highlight trends and comparisons, drawing users’ attention with polished, professional transitions.
Features
Smooth, performant animations for dynamic data display
Customizable colors, labels, and layouts for any style
Responsive design ensures clarity on all screen sizes
Easy integration and setup inside Framer projects
Component Controls
Data Input – Add values and labels for your bars
Bar Color – Customize individual or grouped bar colors
Animation Speed – Control how fast bars animate on render