About DataVizPro
Create beautiful, responsive data visualizations without code. DataViz Pro turns your numbers into polished line, bar, and area charts that fit perfectly inside any Framer frame.
Why DataViz Pro?
Works instantly on canvas and published sites
Mobile-safe fit-to-frame layout (no overflow on small screens)
Smooth animations, sharp labels, modern visuals
Accessible labels for screen readers
Key Features
Multiple data sources: Manual input, CSV, or live API connection
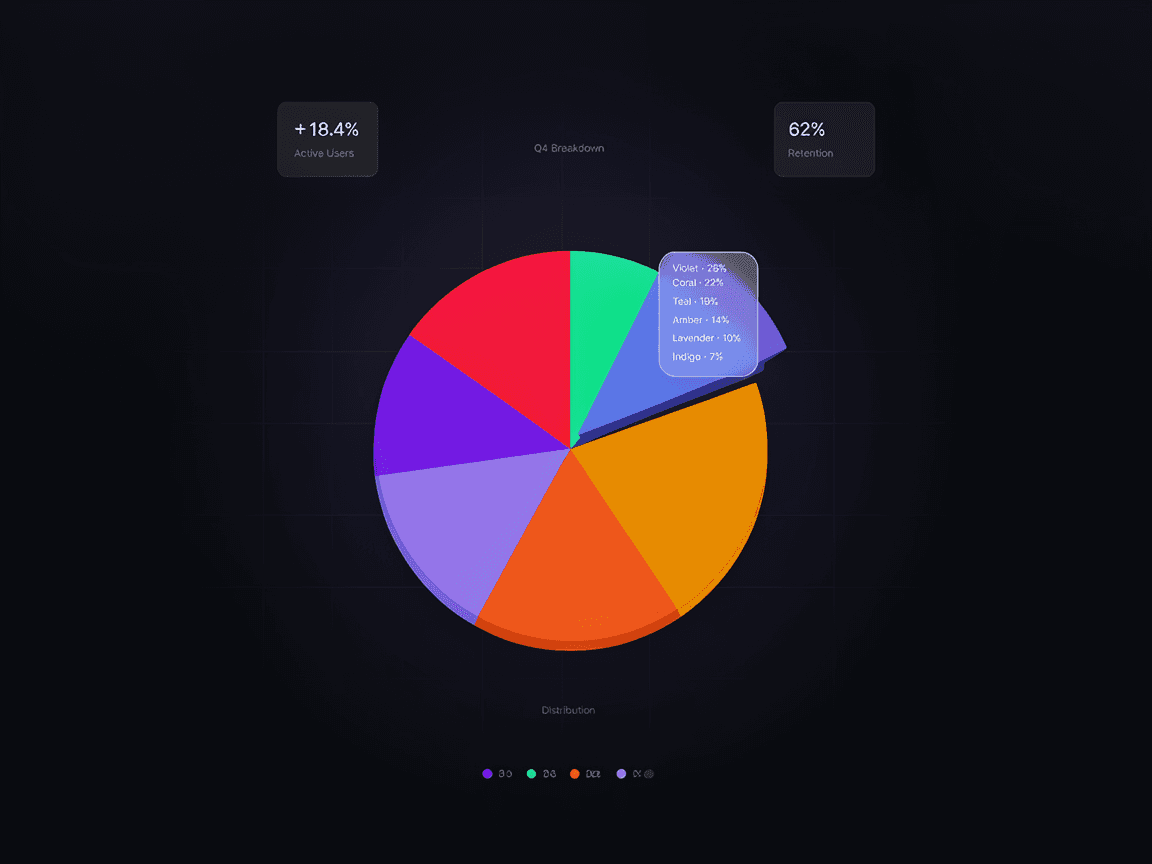
Chart types: Line • Bar • Area
5 design themes: Light, Dark, Neon, Minimal, Glassmorphism
Responsive by design: scales perfectly on all devices
Interactive charts with hover tooltips and optional legend
Easily customizable in panel controls (colors, backgrounds, animation)
Error handling and loading states for API data
Perfect For
Dashboards & KPI cards
SaaS analytics & usage charts
Marketing pages with growth metrics
Reports & presentations
Customization Highlights
Toggle legend or set animation speed
Assign colors to data series
Choose theme and background (solid or gradient)
Smart padding and label scaling for small screens
📱 Responsive BehaviorDataViz Pro always fits the frame you place it in. Resize freely—charts, labels, and paddings adapt for desktop and mobile (including 390px widths).
Tips
Best readability with 6–12 data points per chart
Area for cumulative trends, Line for progress, Bar for comparisons
Hide the legend on tight spaces to maximize chart area
Tech Notes
Built with React and Framer Motion
Optimized for performance
Works in Canvas and published sites
Supports negative values and auto-scaling axes
Accessible with clear labels and semantic structure