About FitTable
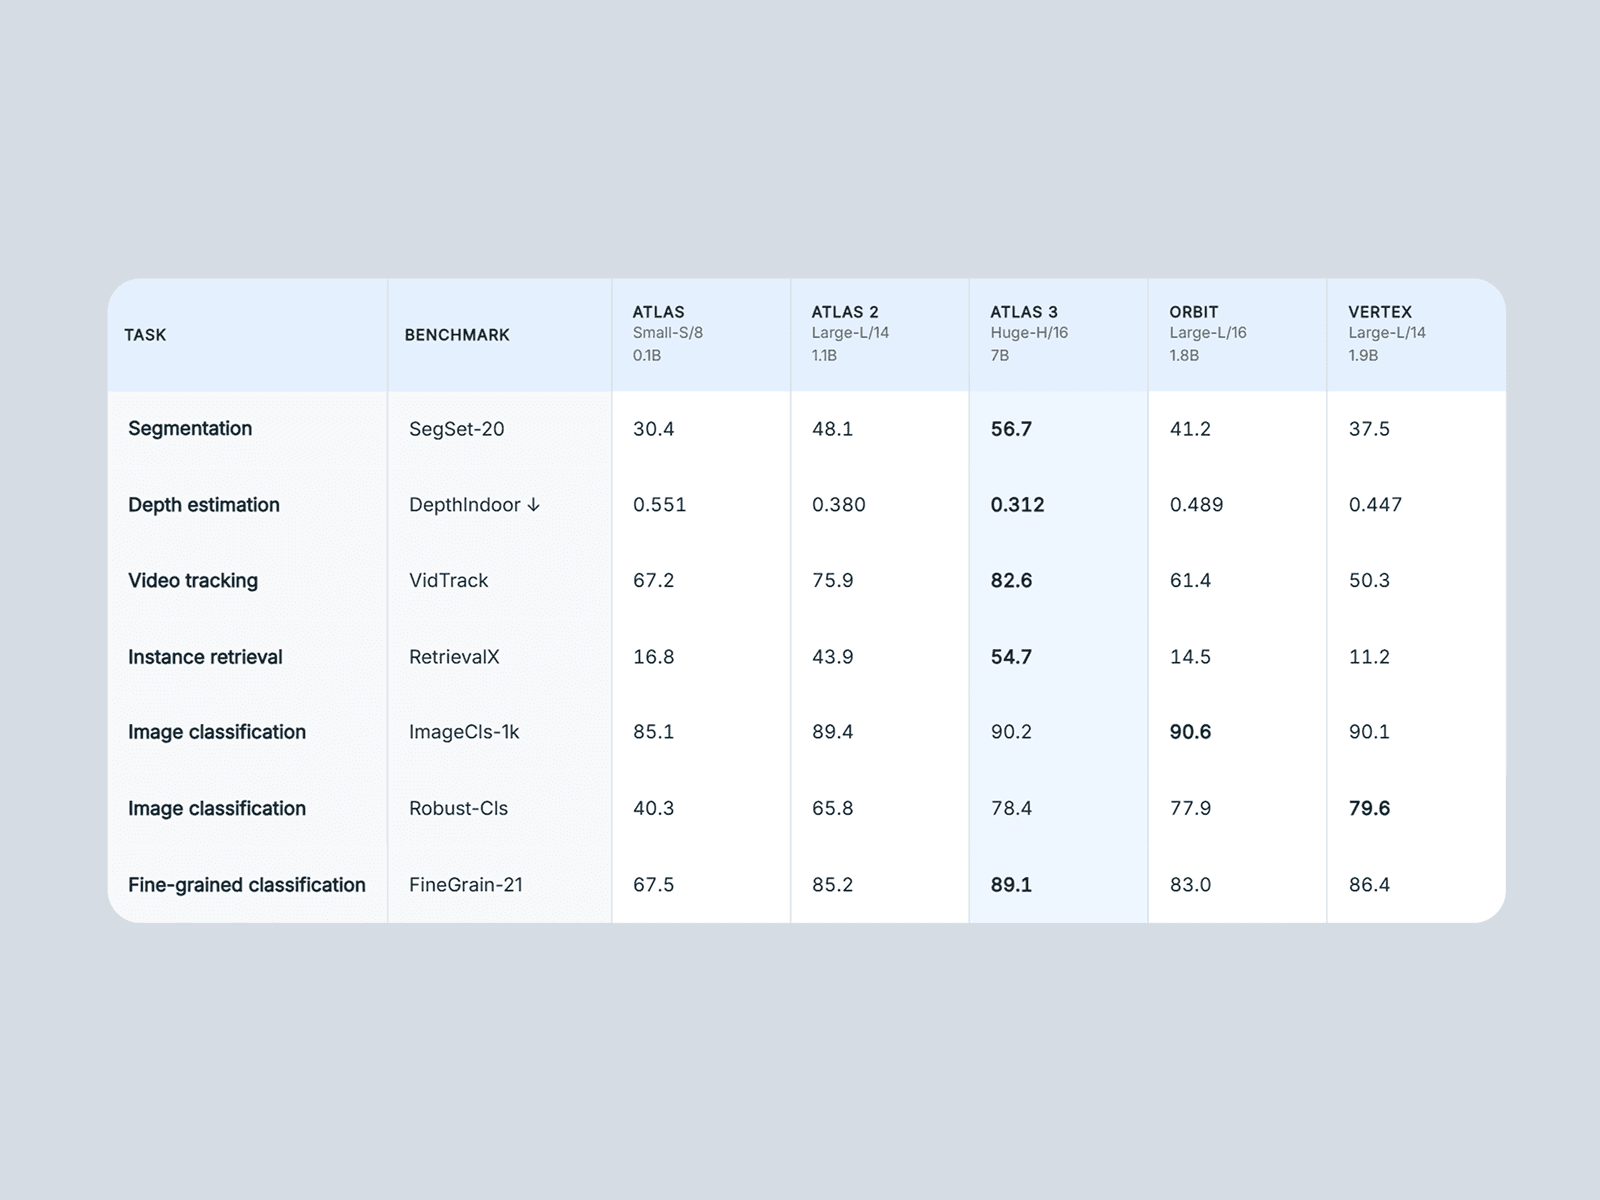
Designing data-heavy comparison tables that look perfect on both desktop and mobile is notoriously difficult. FitTable solves this by dynamically measuring your actual rendered content and scaling the typography and spacing so nothing overlaps and no text breaks out of its cell. Just set your max font size, draw your frame, and let the component do the math.
If your data is simply too large to fit on a mobile screen at a readable size, FitTable automatically switches to a beautiful fallback layout: either a native smooth-scrolling table or a highly readable stacked-card layout.
Key Features
True Auto-Scaling: Typography and cell padding adjust automatically to fit perfectly within your exact container dimensions.
Smart Mobile Fallbacks: Automatically switches to a horizontal or vertical scroll or both.
Automatic Highlighting: Tell the table if a "higher" or "lower" number is better, and it will automatically bold the winning benchmark in every row.
Highlight Columns: Easily spotlight a specific product or pricing tier with dedicated highlight background colors.
Native Property Controls: Full control over corner radii, row/column dividers, hover states, fonts, and 9 different color properties.
Zero Dependencies: Built purely with React and Framer’s native APIs for maximum site speed.
How Data Entry Works No code required. Build your table entirely from the Framer property panel:
Columns: Add an item for each product/model. Supports a Title, two Subtitles, and a Highlight toggle.
Rows: Add a task/benchmark name. For the data, simply paste your values separated by a pipe (
|) or a tab (perfect for pasting directly from a spreadsheet).
Use Cases
SaaS Pricing Comparisons
Tech Spec & Hardware Benchmarks
Feature Matrices
Financial Data Displays
Product Comparisons
Analytics Dashboards