About LineChart Pro
LineChart Pro – Data Visualization built for designers
Turn your data into polished, animated and fully customizable charts. Professional animations, infinite customization, perfect for dashboards and data-driven designs.
Key Features
Multiple data sources
Manual values
Google Sheets
CSV files with automatic parsing and column selection.
Three Powerful Visualization Modes
Area Charts – Smooth gradients with customizable fills and stepped color transitions
Bar Charts – Dynamic vertical bars perfect for comparisons
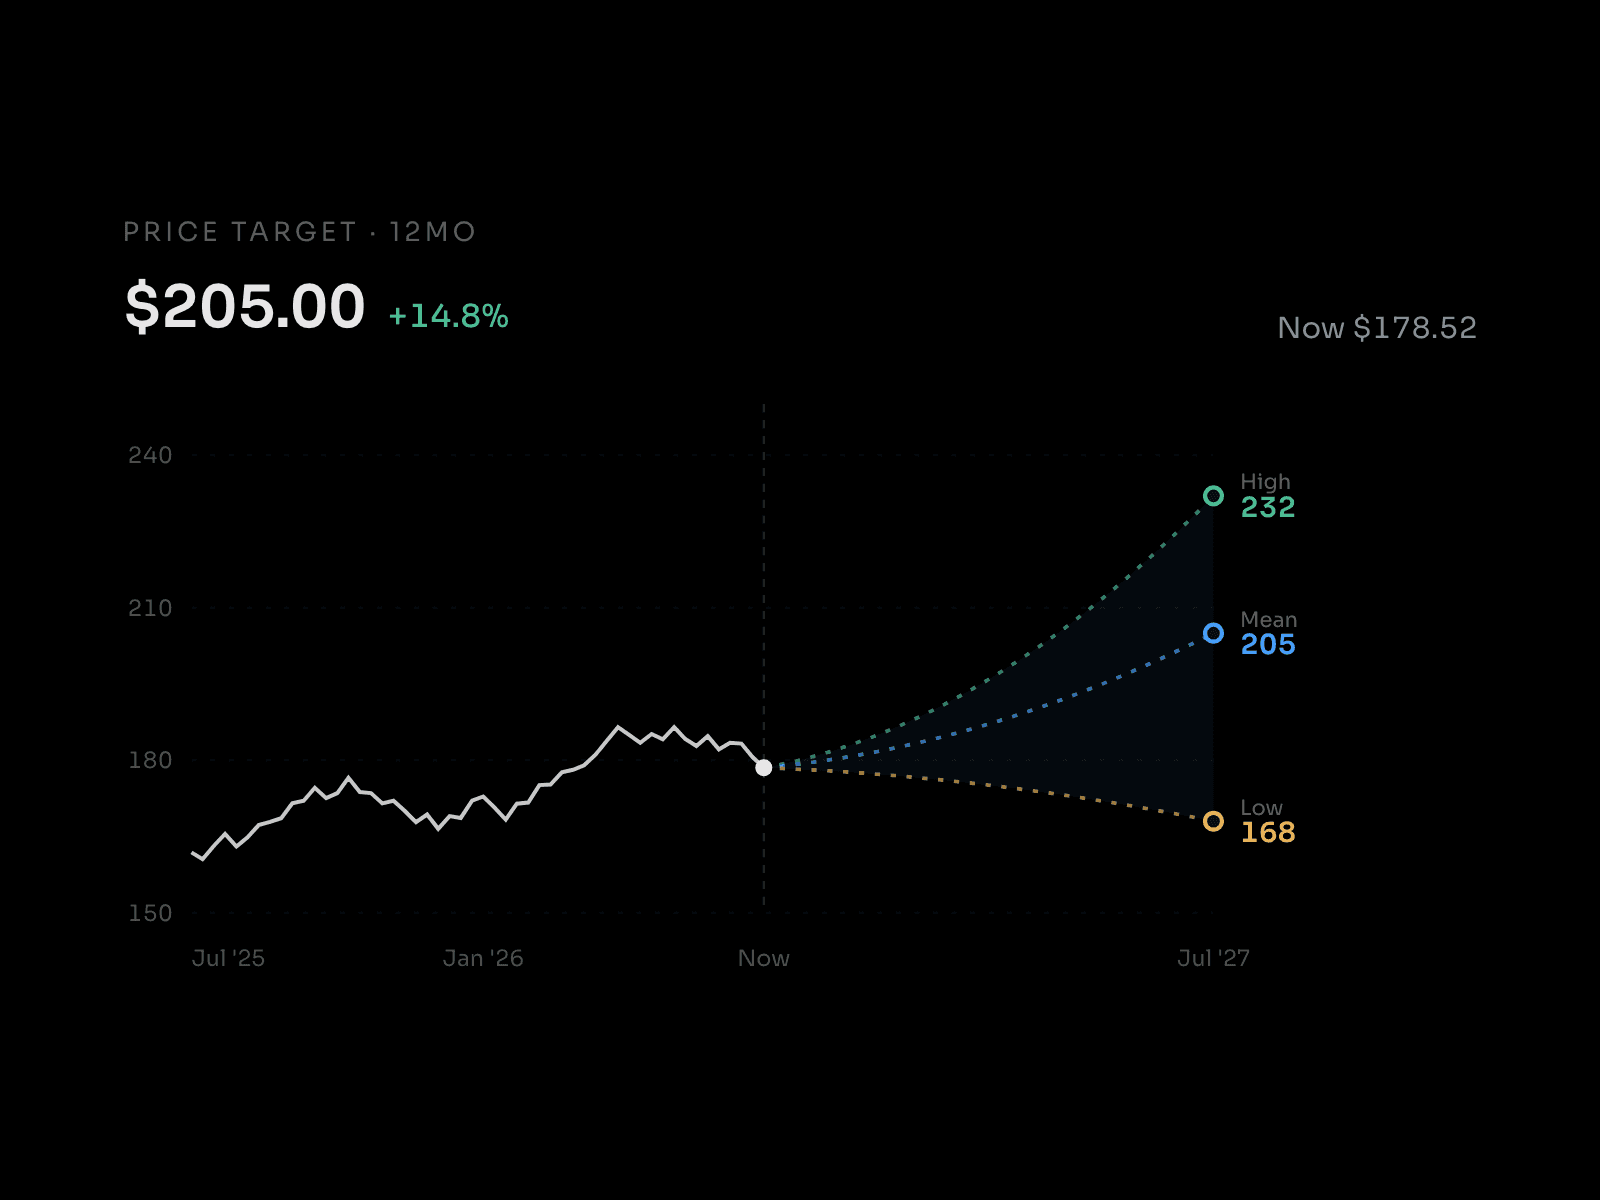
Fan Charts – Unique radial visualizations for creative presentations
Studio-Quality Animations
Silky-smooth enter animations with customizable timing and easing
Smart in-viewport detection – charts animate only when visible
Point-by-point staggered reveals for dramatic effect
Variant-triggered animations that replay on state changes
Performance-optimized for multiple charts on a single page
Infinite Customization
Multiple Curve Types: Smooth bezier, basis curves, or step modes
Gradient Control: Linear or stepped color transitions for fills and strokes
Axis Configuration: Independent control for X/Y axes, labels, and grid lines
Interactive Elements: Built-in cursor tracking and hover states
Typography Control: Full font customization for all text elements
How It Works
Why Choose This Component?
Save Hours of Development
What would take days to code is ready in minutes. Focus on your design, not wrestling with SVG paths and animation libraries.
Professional Results
Built with production-grade code, performance optimizations, and attention to detail that shows in every pixel.
Future-Proof
Regular updates, active support, and built on modern React and Framer Motion foundations.
Keywords
Chart, Charts, Line chart, Bar chart, Area chart, Fan chart, Data visualization, Data viz, Dashboard, Analytics, Data charts, Graph, Graphs, Animated charts, Interactive charts, Data component, Visualization component, SVG charts, Customizable charts, Responsive charts, Gradient charts, Hover interaction, Tooltip, Live data, Google Sheets data, CSV data, Dynamic data, SaaS dashboard, Statistics, Metrics, KPI Professional animation, Smooth animation, Animated graph, Data-driven design