About Live Stock Chart
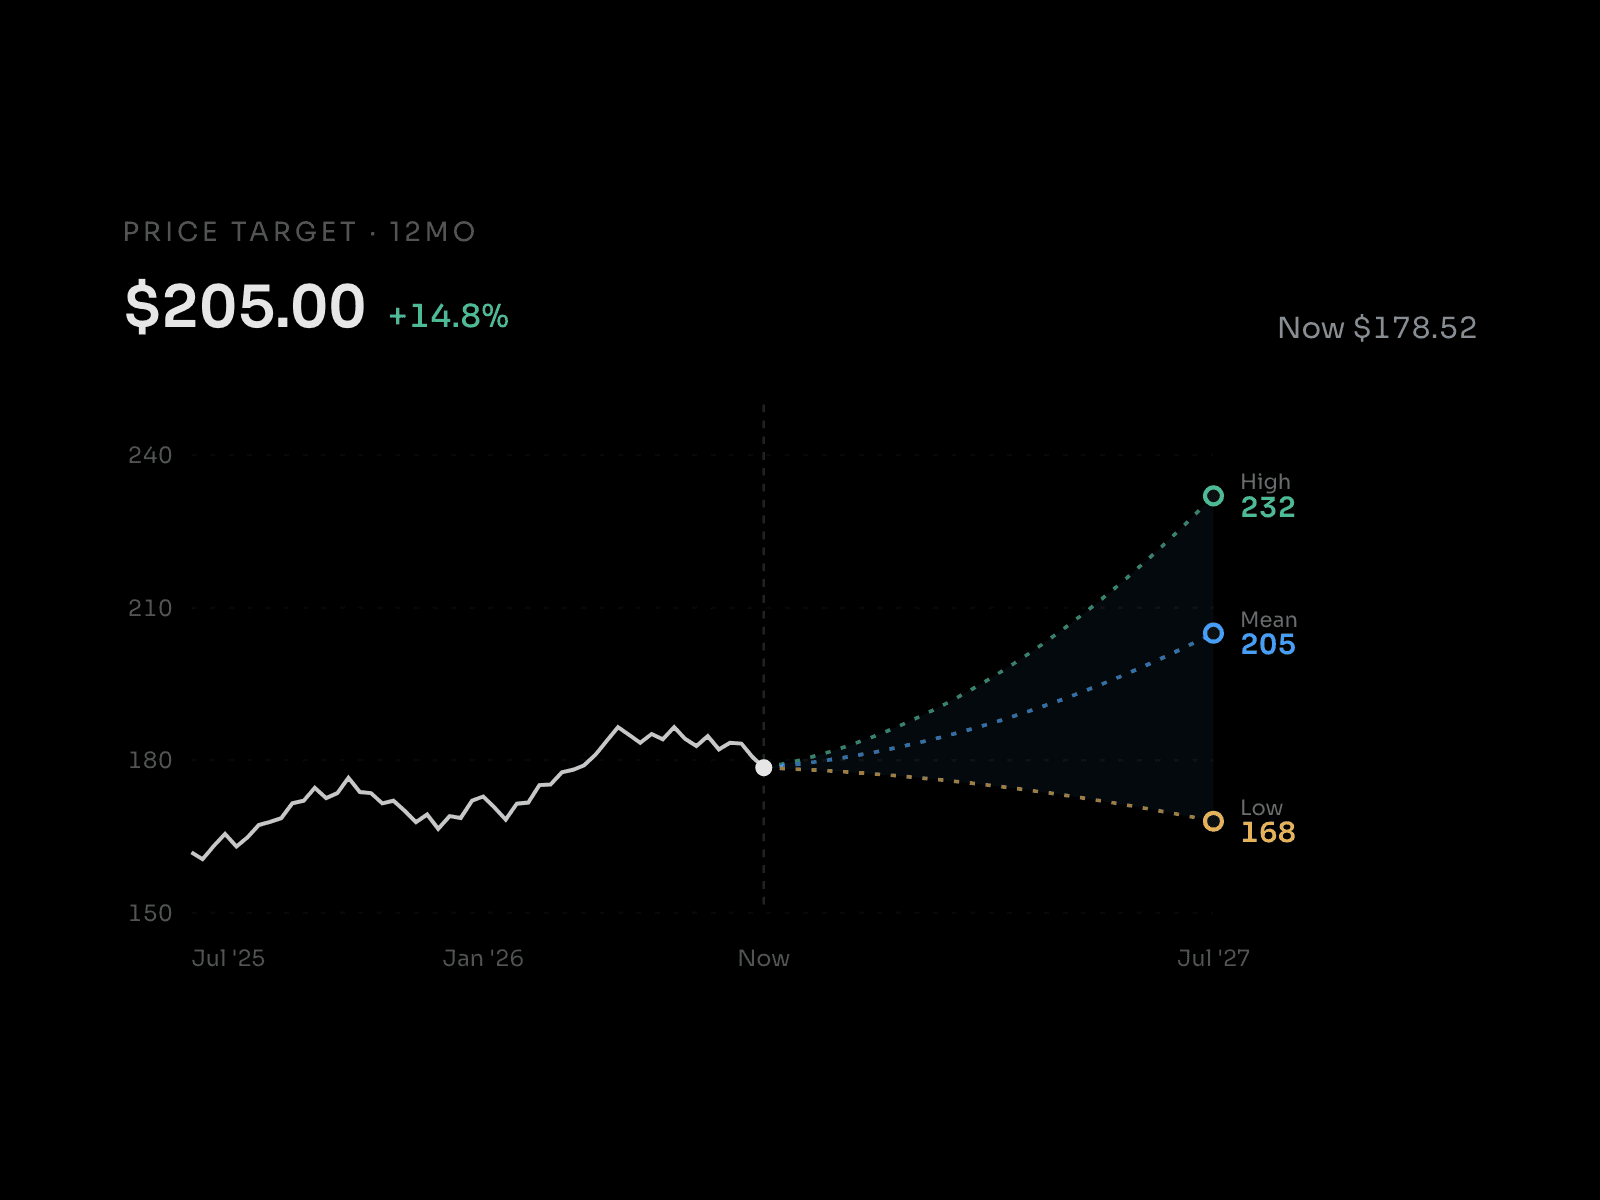
Bring realtime market data to your Framer project with a clean, modern Stock Chart component. Fully responsive and optimized for both dark and light interfaces, this component displays live pricing, daily change, interactive timeframes, and a smooth line chart — all without requiring an API key. It uses a reliable, fast data source and automatically refreshes, making it ideal for dashboards, fintech products, analytics pages, and any website that wants to present stock performance in a professional way.
Features included:
Realtime stock price with automatic updates
Daily price change with green/red dynamic color indicators
Percentage movement based on the latest market data
Interactive timeframe selector (1D, 5D, 1M, 3M, 6M, 1Y)
Smooth, responsive line chart that adapts to any size
Instant loading state when switching periods (no lag)
No API key required — works out of the box
Company name + symbol pulled directly from market data
Automatic dark and light mode styling
Customizable accent colors, background, radius, and shadows
Lightweight + fast, optimized for Framer performance
Perfect for:
• landing pages
• dashboards
• crypto/stock comparison sites
• fintech startups
• investor relations pages
• SaaS analytics sections
• product previews
A simple, beautifully designed way to bring live financial data into your site with zero setup and clean professional visuals.