About Rush Hours
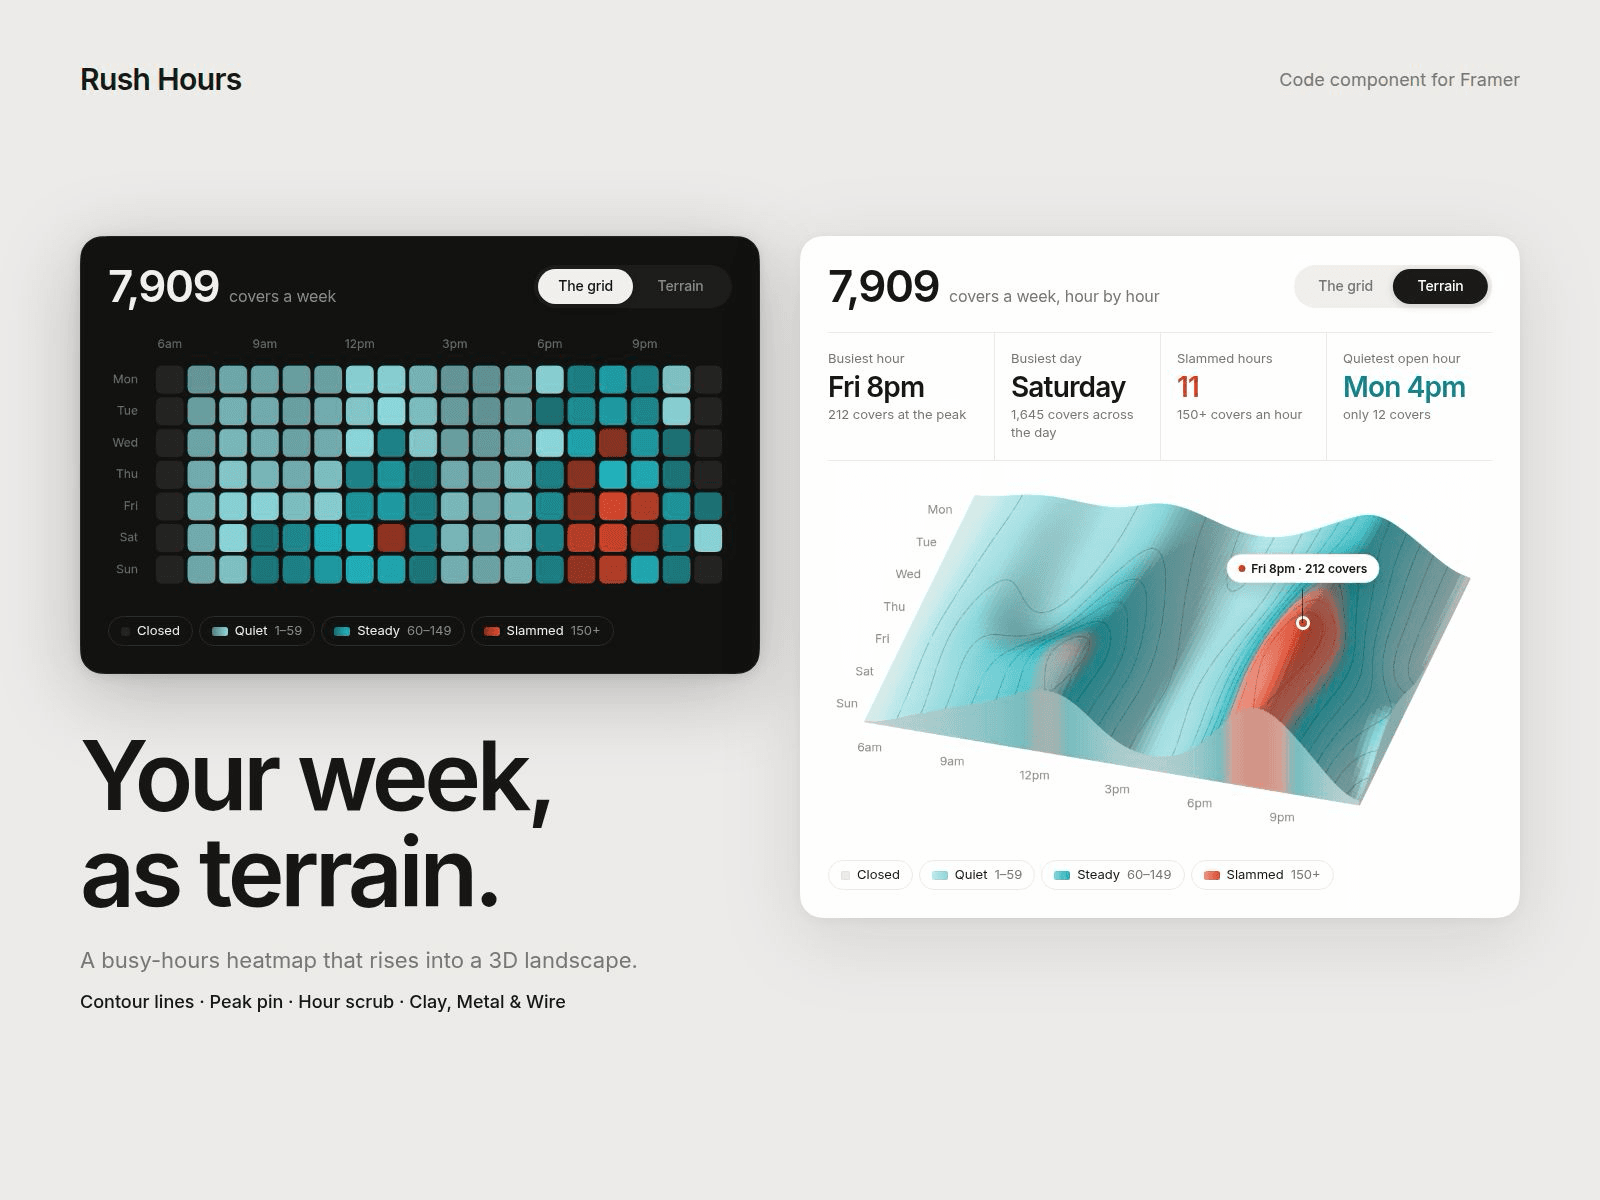
Rush Hours shows a week of hourly numbers as a clean heatmap card. One switch tilts the same grid into a smooth 3D landscape: your busiest hour becomes a mountain, quiet afternoons become valleys. Covers, visits, bookings, sign-ups, anything you count per hour.
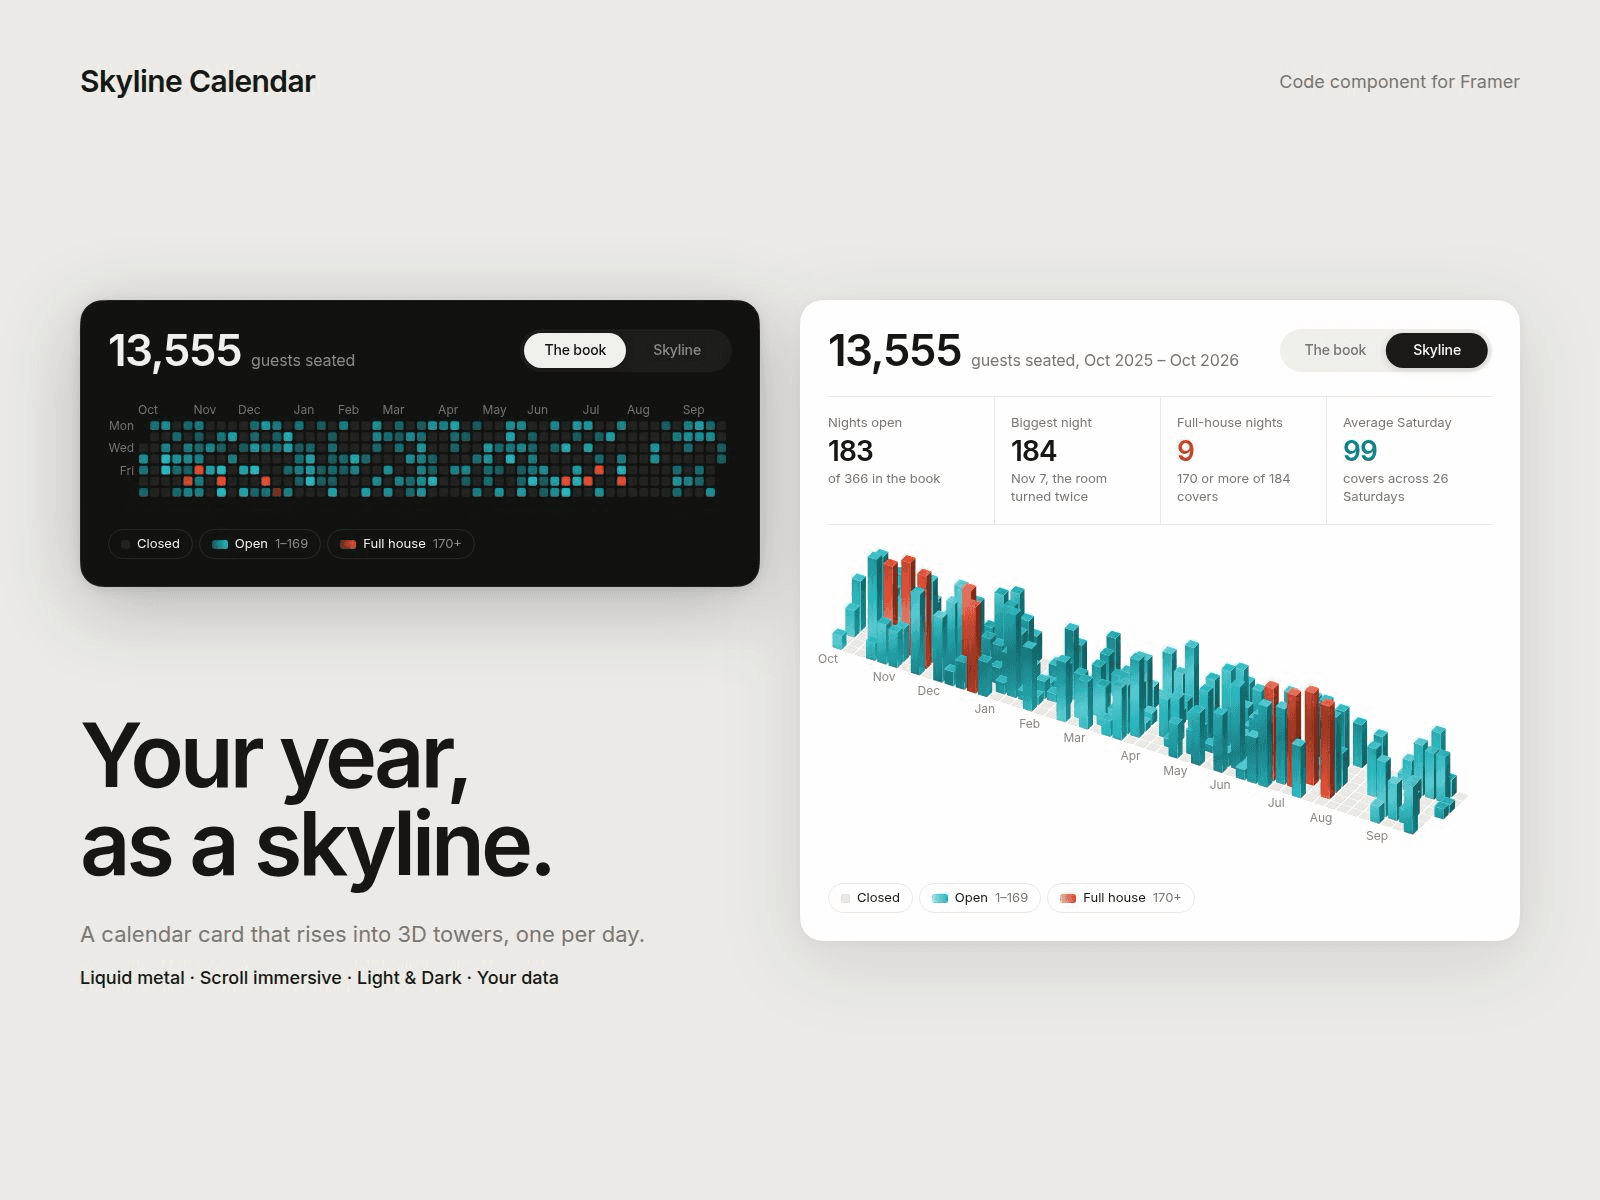
The companion to Skyline Calendar: Skyline shows which days were busy, Rush Hours shows which hours are.
Five ways to switch:
• Button: a sliding toggle with your own labels
• Hover or Click: the card flips
• Loop: plays back and forth on its own
• Scroll: the tilt follows the page, with an optional pin
Immersive mode fades the card away so the landscape stretches to full screen width.
A landscape you can shape:
• Smoothness from blocky steps to rolling hills
• Topo contour lines with density, colour and width
• Category colours band the slopes, from quiet to slammed
• A peak pin that labels your busiest hour, like "Fri 8pm · 212 covers"
• Hover scrub: an hour's slice lights up with a tooltip, click to pin it
• Clay, Liquid Metal or Wireframe material
• Rotation, tilt, height, depth and stagger
Your data, your categories:
• Paste seven lines, Monday first, 24 numbers each (0 or - means closed)
• Pick the hours shown, 12h or 24h labels and the first weekday
• Build your own categories with a name, a starting value and a colour
• Header total, four stat tiles (busiest hour, busiest day, quietest hour, averages or your own text) and a legend, all calculated for you
Everything is editable:
• Every label, tooltip and weekday name
• Light, Dark or Custom theme with full colour control
• Font, radius, padding and shadow
Animations pause when the card is off screen or the tab is hidden.
Getting started:
1. Drop Rush Hours onto your page.
2. Pick a Trigger, a Theme and a Material.
3. Set Data to Custom and paste your week.
4. Rename the categories and stats to match what you count.
5. Use Canvas Scrub to preview any point of the tilt.