About Weekly Metrics
MORE FRAMER COMPONENTS LIKE THIS
✦ Browse +38 FREE + 85 premium components: https://frameze.com/components
About Weekly Metrics
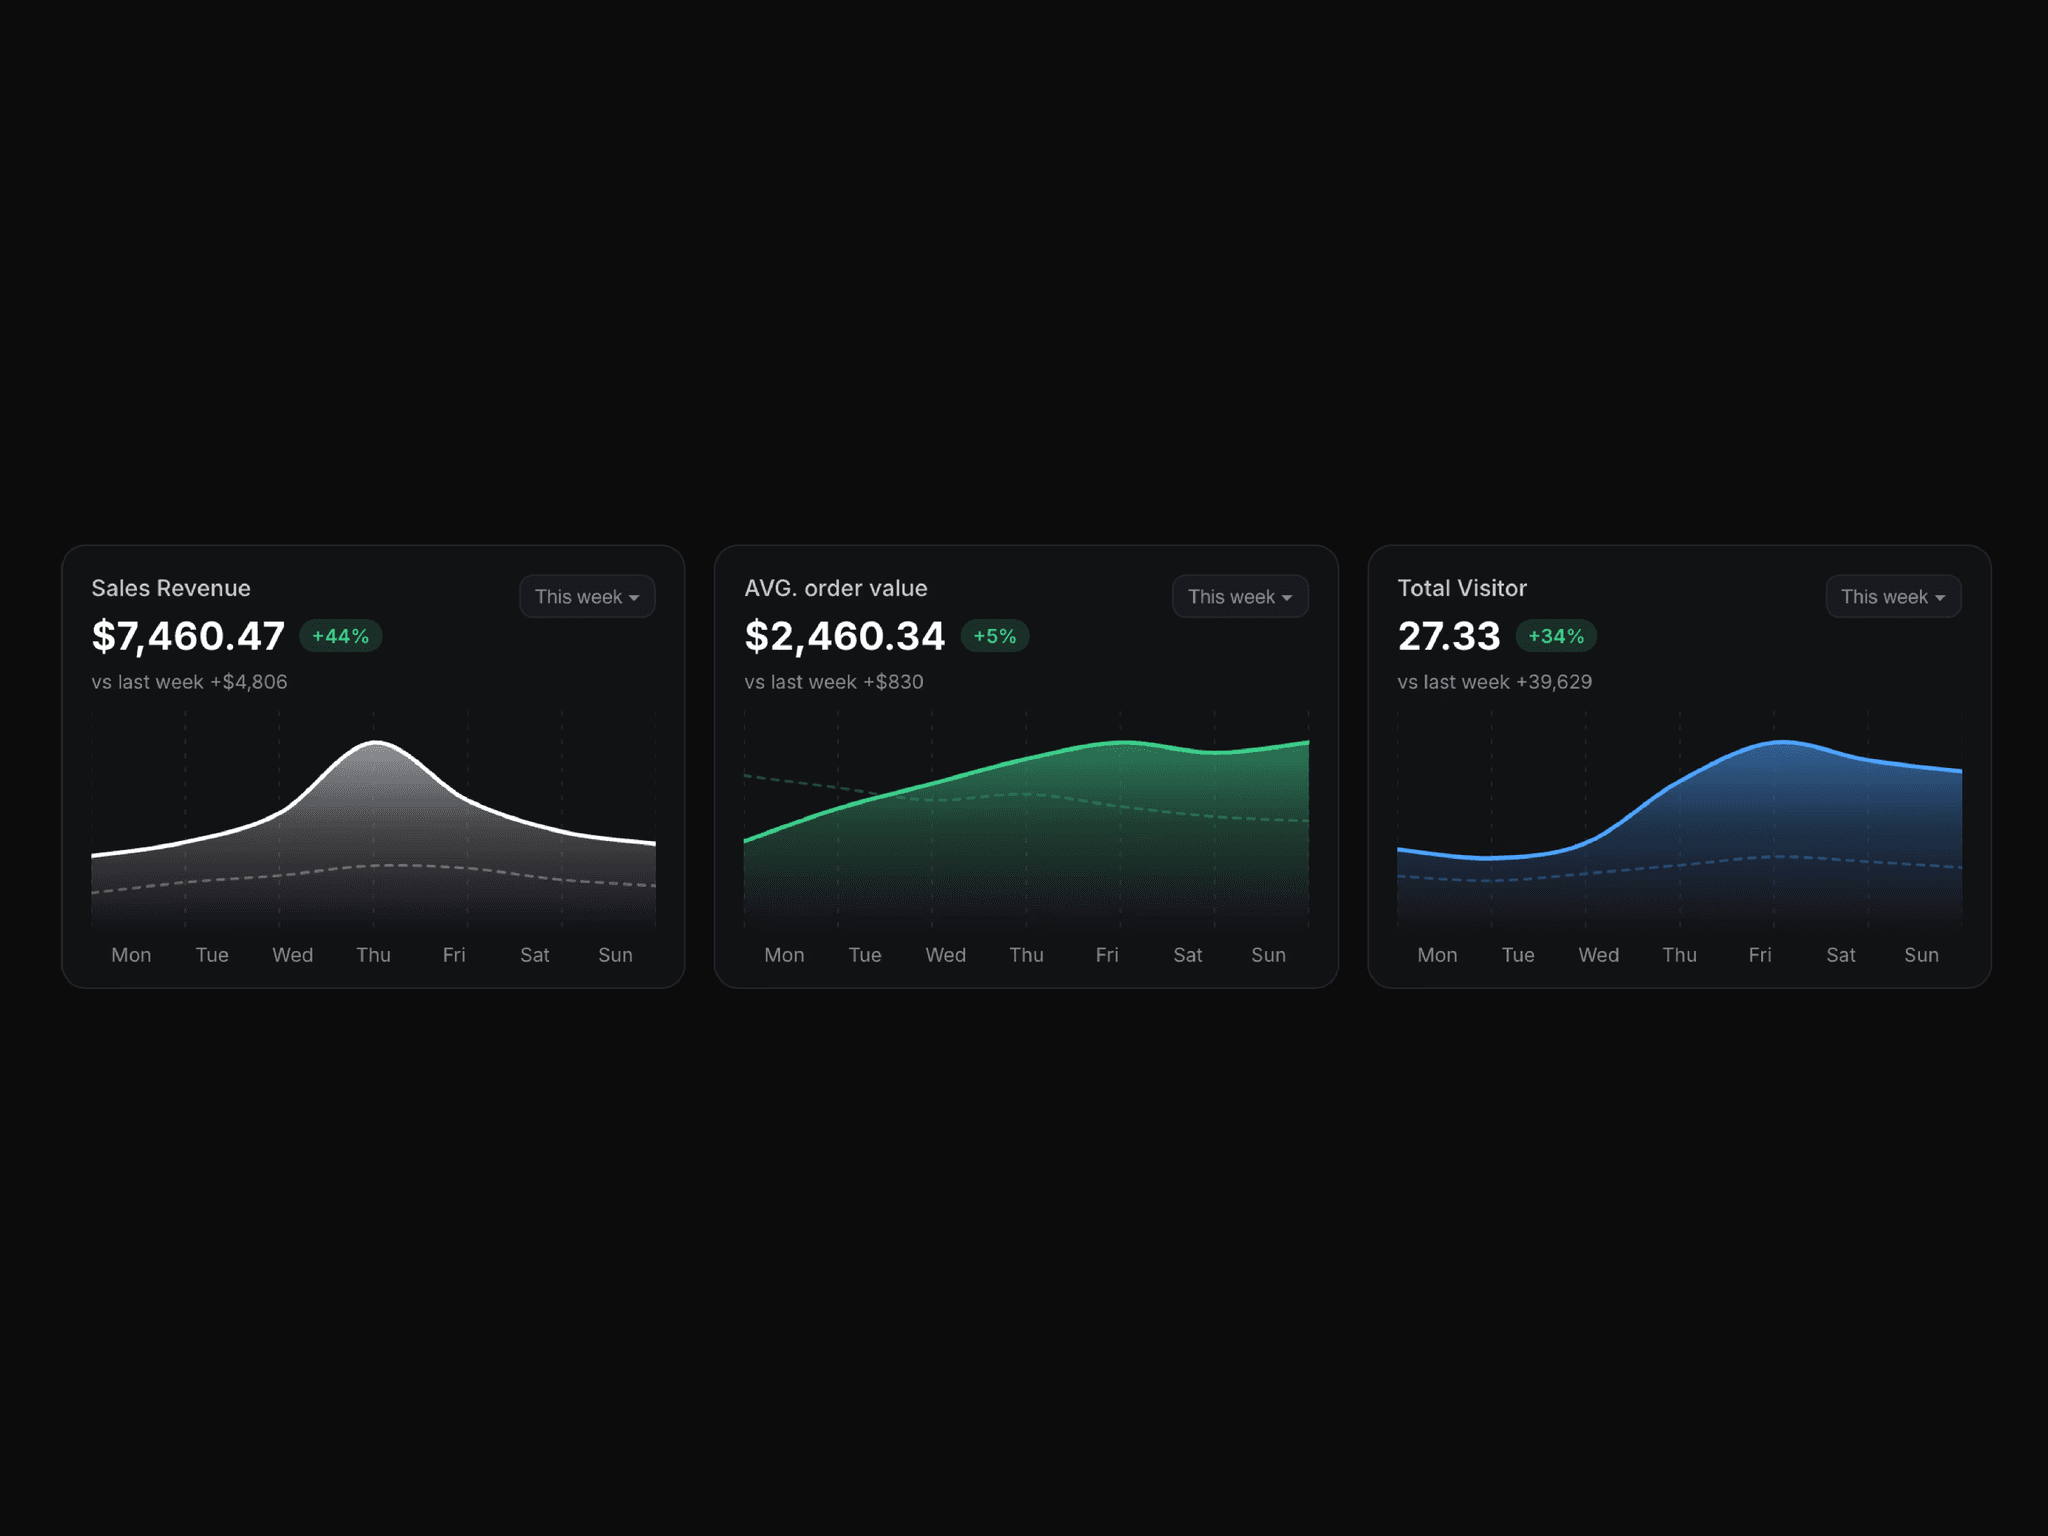
Weekly Metrics is a Framer analytics component for dashboards, SaaS pages, and reports. It shows three KPI cards—Sales Revenue, Average Order Value, and Total Visitors—with this-week vs last-week comparison, hover tooltips, and animated line charts that stay readable from desktop to mobile.
Interactive hover tooltips for Monday–Sunday values • Smooth or straight line styles with gradient area fill • Ghost comparison line for the opposite week • 1, 2, or 3 visible cards from Demo Mode or property controls • Compact, Default, and Detailed density • Auto-calculated percent change and compact numbers (K / M) • Count-up value animation with static-renderer safe fallback • Stacked mobile layout below a custom breakpoint • Grouped theme and per-card controls: titles, prefixes, colors, data • Accessible labels, keyboard chart navigation, and indexable metric text • Works out of the box — paste weekly data, publish
Use Cases
SaaS product dashboards and admin previews
Ecommerce sales and AOV highlight sections
Startup landing pages with traction metrics
Investor updates and pitch-site snapshots
Marketing reports and campaign recap pages
Analytics, CRM, and fintech product sites
Agency case studies with before/after weeks
Newsletter or blog posts that need live-looking KPIs
Portfolio sites for product and data designers
Keywords
weekly metrics, kpi cards framer, sales revenue chart, average order value, total visitors widget, this week last week, interactive line chart, dashboard component framer, hover tooltip chart, sparkline cards, analytics cards, saas metrics section