About 03 Venn Diagram
■ What it does
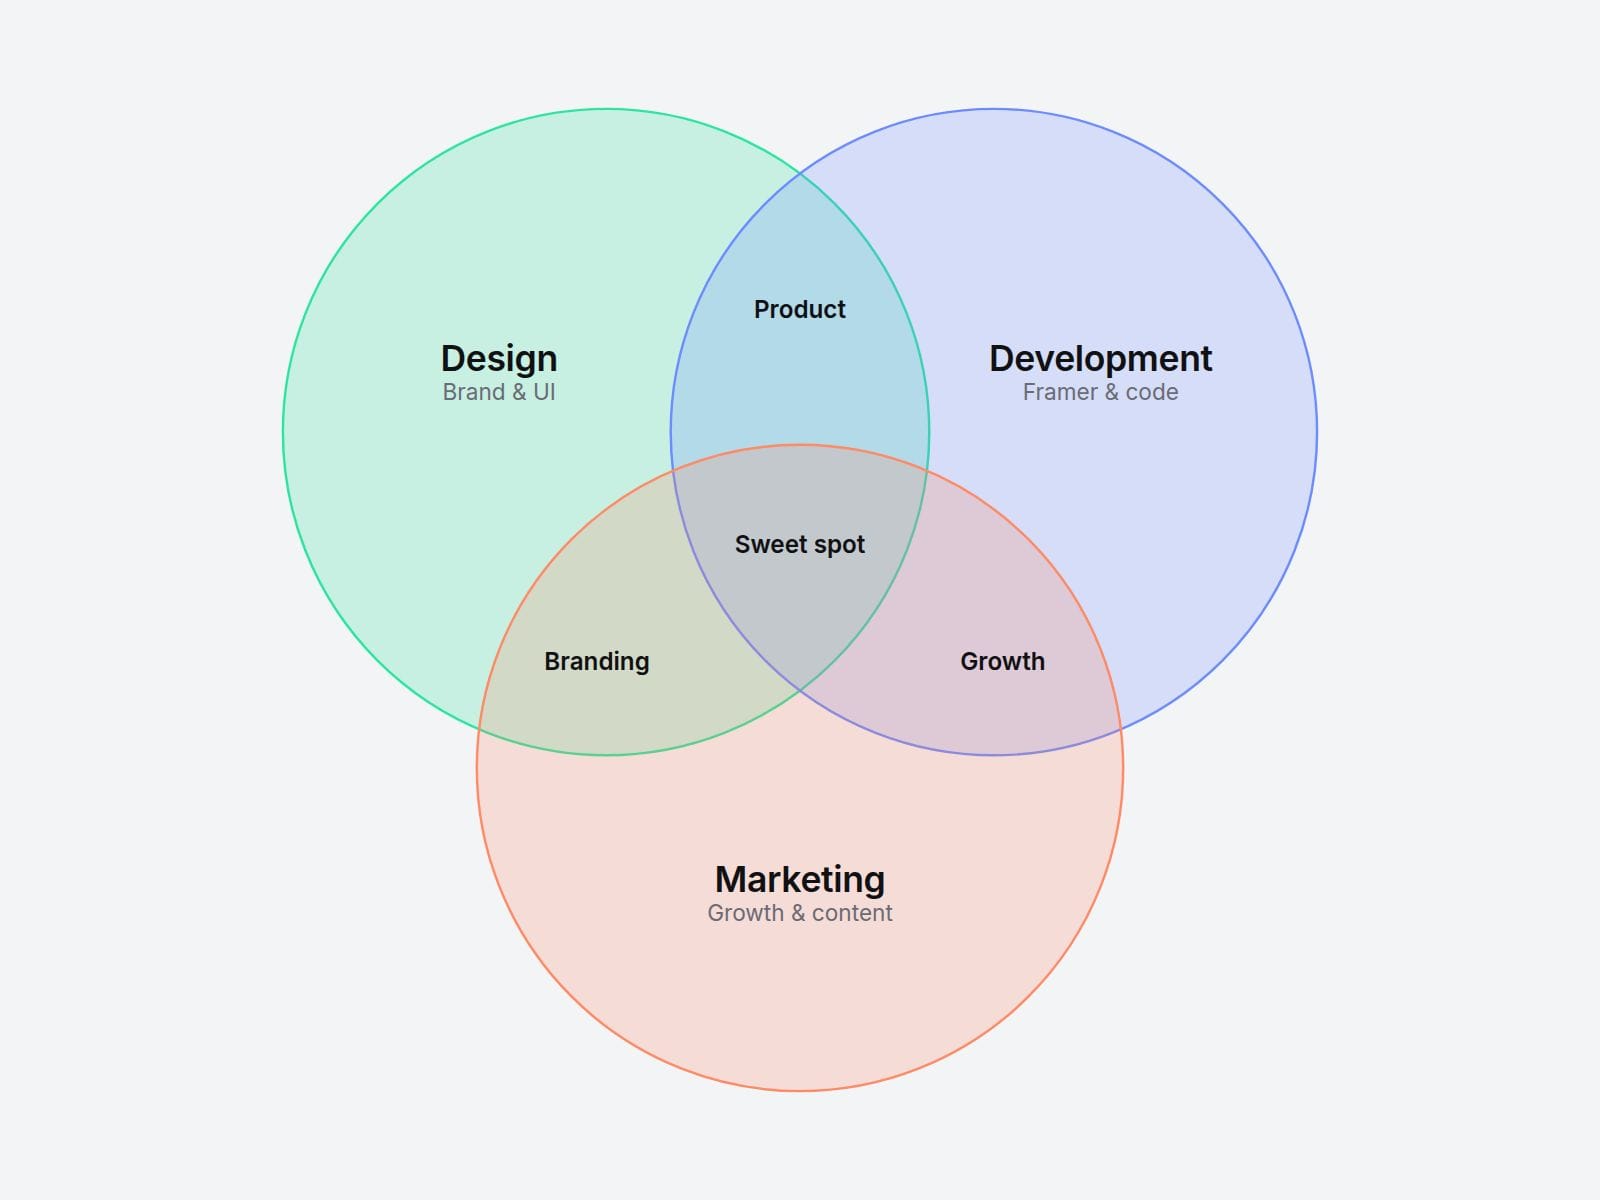
Explain how your skills, services or ideas overlap — in one clean diagram. Name each circle and every overlap (up to 7 areas), and visitors can hover or tap any area to see a short explanation in the caption below.
Perfect for agency "what we do" sections, portfolios, SaaS positioning and pitch-style landing pages.
■ Customizable properties
• Circles — 2 or 3
• Circle A / B / C — label, note, color and a hover detail
• Overlaps — A∩B, A∩C, B∩C and Center labels with their own details
• Overlap — how close the circles sit (10–80%); labels re-position automatically
• Fill — Tint, Blend (colors mix where they overlap) or Outline
• Hover Highlight — highlights exactly the area under the cursor (tap on mobile)
• Caption — default text, shown or hidden
• Entrance — circles glide in once when scrolled into view
• Style & Fonts — text, stroke, highlight and caption colors; label, note, region and caption fonts
■ Why this component
• Real area-by-area interaction: each overlap is its own hover target.
• Labels place themselves inside the correct area, whatever overlap you choose.
• Pure SVG: crisp at any size, text scales with the diagram.
Built with code but fully customizable via property controls — no coding needed. Unlink is not provided so we can keep delivering updates. When an update is available, just click the Update button on the component.