About 29 Radar Chart
What it does
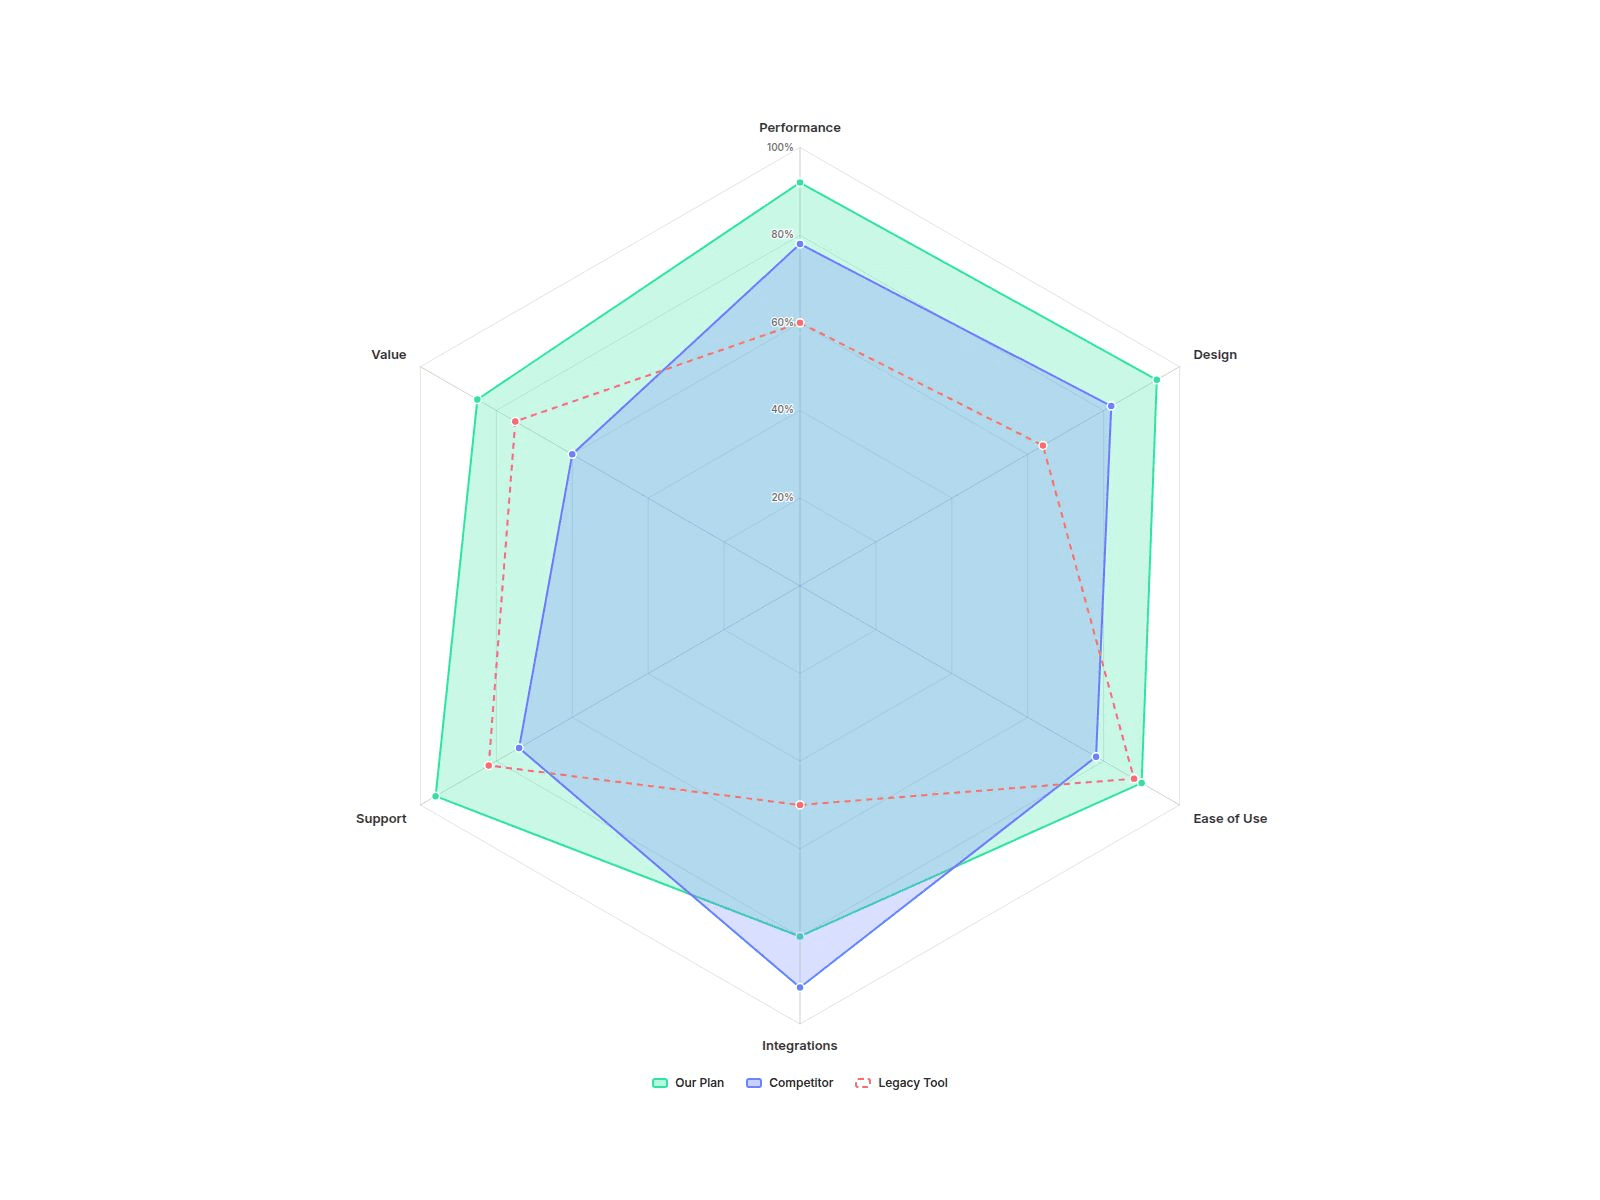
Radar Chart draws a multi-series spider chart from a simple list: name your axes, type each series' values, done. Compare plans, products or skill profiles on one polygon, even when every axis uses a different unit.
Customizable properties
• Axes: up to 12, each with label, max and unit (%, ★, $, / 100)
• Series: up to 5, each with name, values, color and style (Fill, Line, Dashed)
• Scale: Fixed, Per Axis or Auto
• Compare: Overlay or Gap 1 vs 2 (shades who leads on each axis)
• Curve: Straight or Smooth; Grid: Polygon or Circle; rings and scale labels
• Point values: Off, On Hover or Always
• Legend (bottom, top, right) with click-to-hide, tooltip, dim others
• Colors, fonts, padding, point size, line width, fill opacity
• Animate In: draws once on scroll, then morphs when values change
Why this component
• Mixed units, one chart: give each axis its own max and unit. The tooltip shows real values like 4.7★ or $1,200.
• Gap shading: switch Compare to Gap and the area between series 1 and 2 is colored by whoever is ahead, the fastest way to show "where we win".
• A legend you can use: click to hide a series, hover to spotlight it.
• Wide hover targets: hover anywhere along an axis to read every value, no pixel hunting.
• Calm by design: draws once when it scrolls into view; the editor and reduced-motion visitors see the finished chart.
• Keyboard focus and screen-reader labels on every axis.
Need help?
Reach out anytime at hello@brandingupstudio.com. We usually reply within 1 business day.
Need more? All 10 paid BrandingUp components in one payment: All-Access Pass, $49 → https://brandingup.lemonsqueezy.com/checkout/buy/3391c106-6fbc-41b8-9cc8-b63365b95665
Built with code but fully customizable via property controls, no coding needed. Unlink is not provided so we can keep delivering updates. When an update is available, just click the Update button on the component.