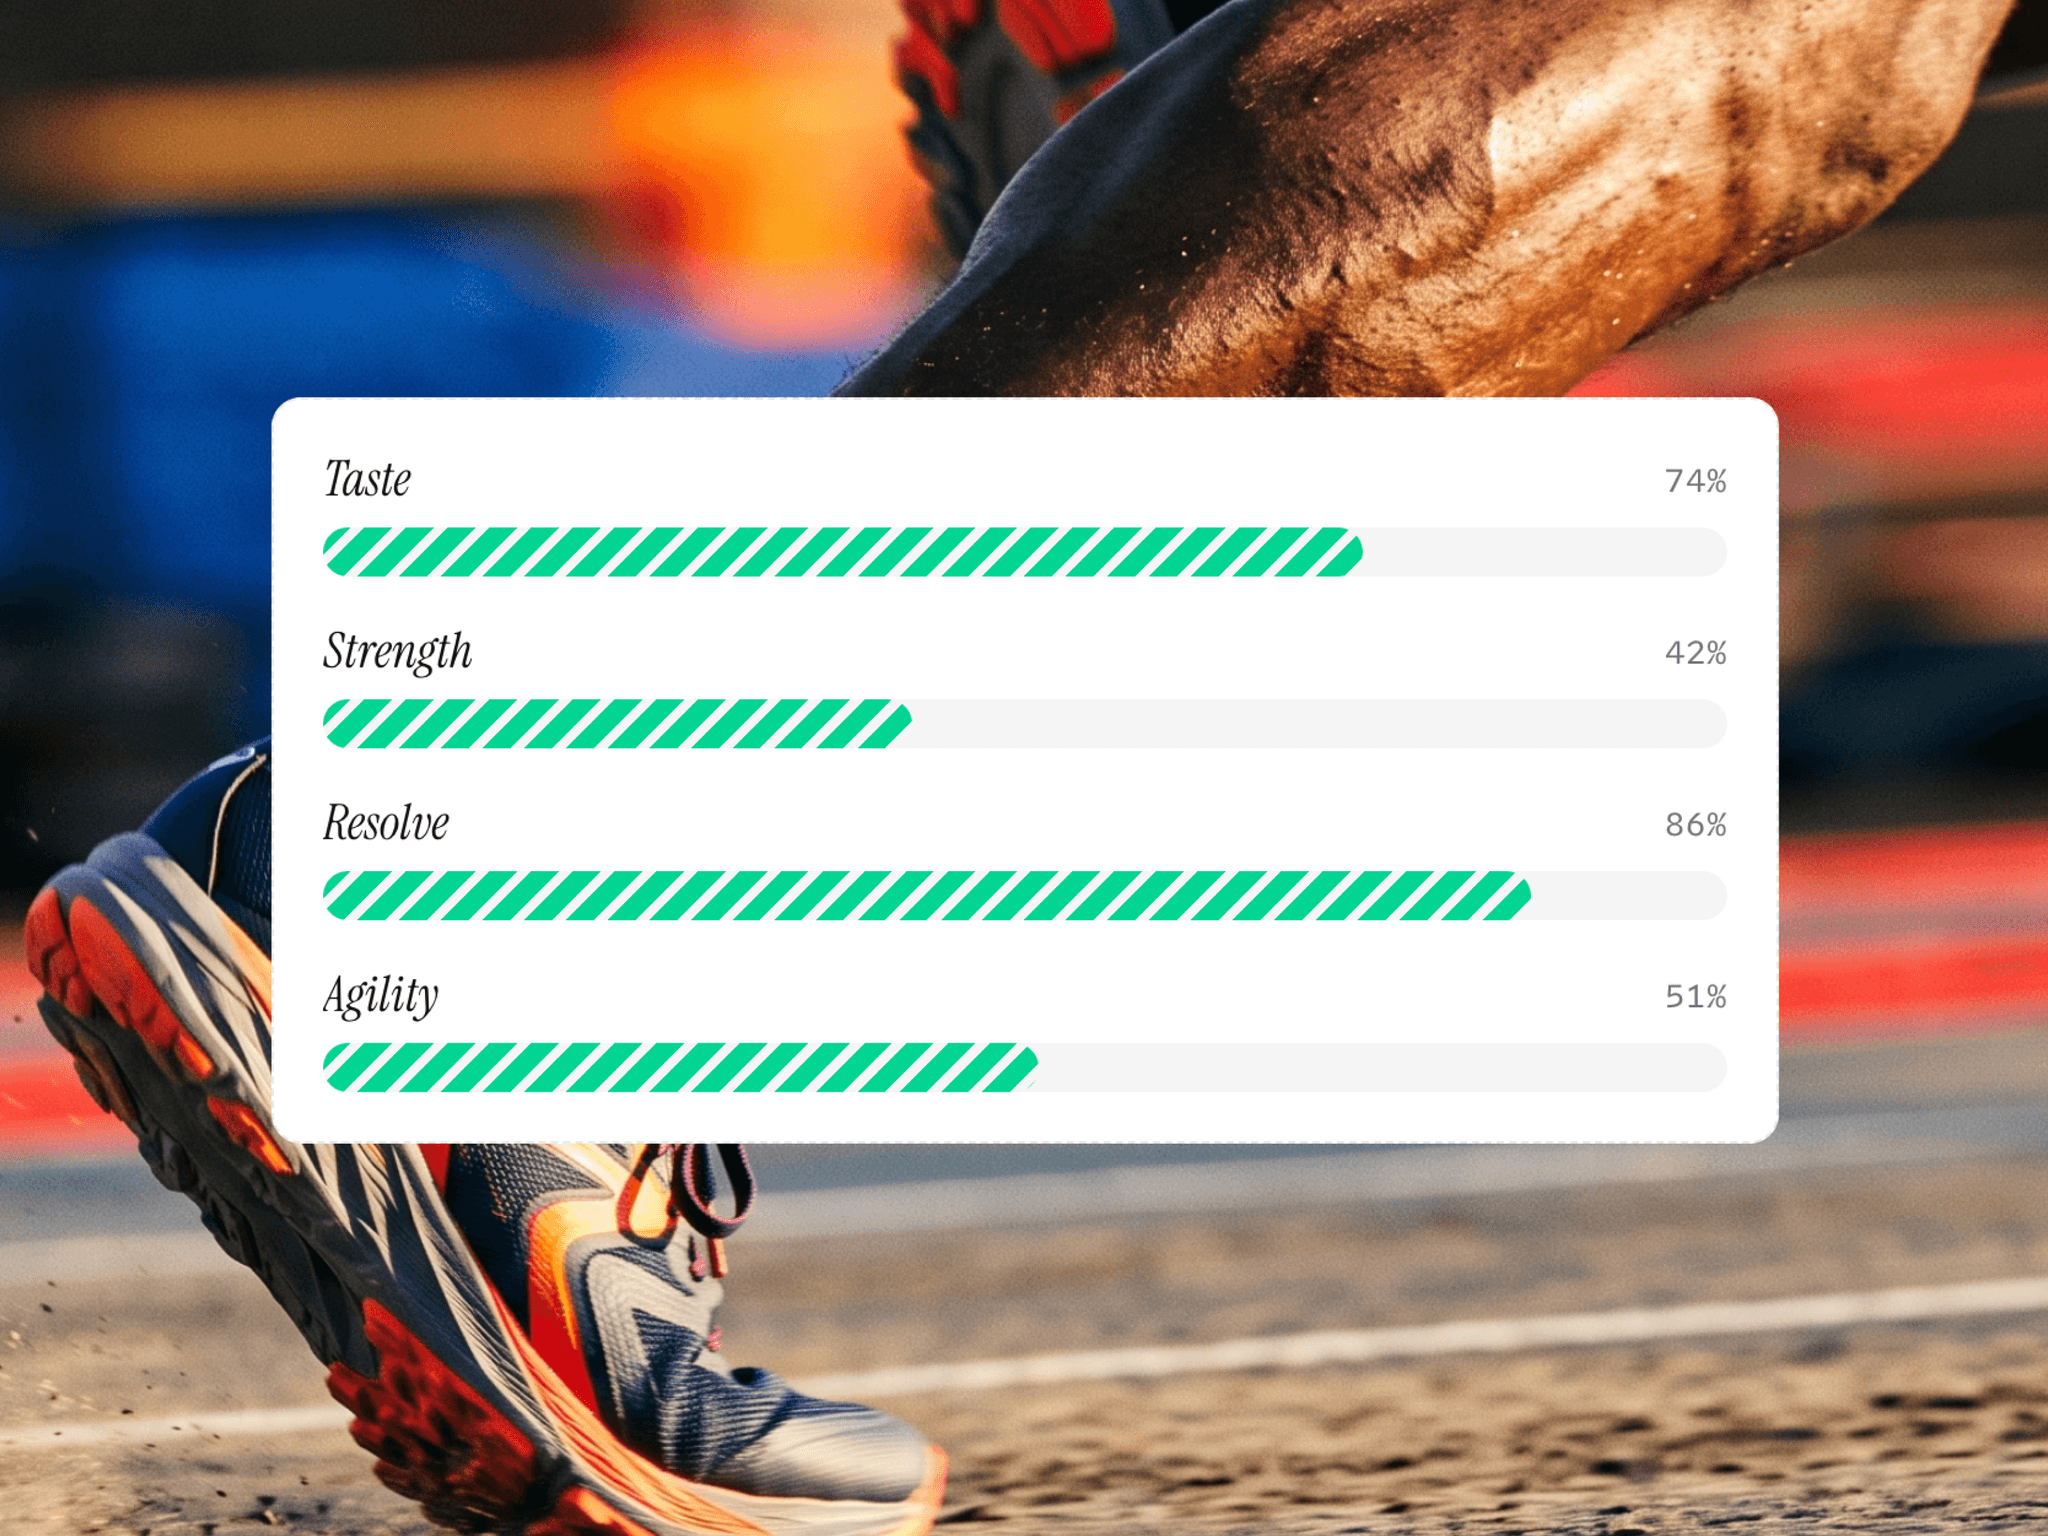
About Apex Chart
About this Component
The Apex Chart Component brings powerful, fully customizable charts to your Framer projects—without writing a single line of code. Powered by the ApexCharts library, it enables you to transform raw data into beautiful, interactive visualizations. Perfect for dashboards, analytics, and data-driven applications, this component makes it effortless to communicate insights visually.
Key Features
- Multiple Chart Types - Choose from line, bar, area, scatter, pie, donut, and more.
- Custom Styling - Adjust colors, typography, and layouts to perfectly match your brand.
- Dynamic Data Updates - Automatically refresh charts as your data changes in real time.
- Interactive Elements - Add tooltips, zoom, hover effects, and animations for deeper engagement.
- Optimized Performance - Smooth rendering ensures fast load times and fluid interactions.
How to Set Up
1. Add the Apex Chart Component to your project.
2. Select your desired chart type from the properties panel.
3. Input or connect your data source.
4. Customize colors, labels, and interactivity settings.
5. Preview and publish—your chart is live!
Perfect For
- Data dashboards
- Business analytics tools
- Educational platforms
- Financial and investment apps
- Reports & performance tracking
Support
💬 For any questions, feel free to contact us at this support email: support@zeroqode.com