About FuturisticDonutChart
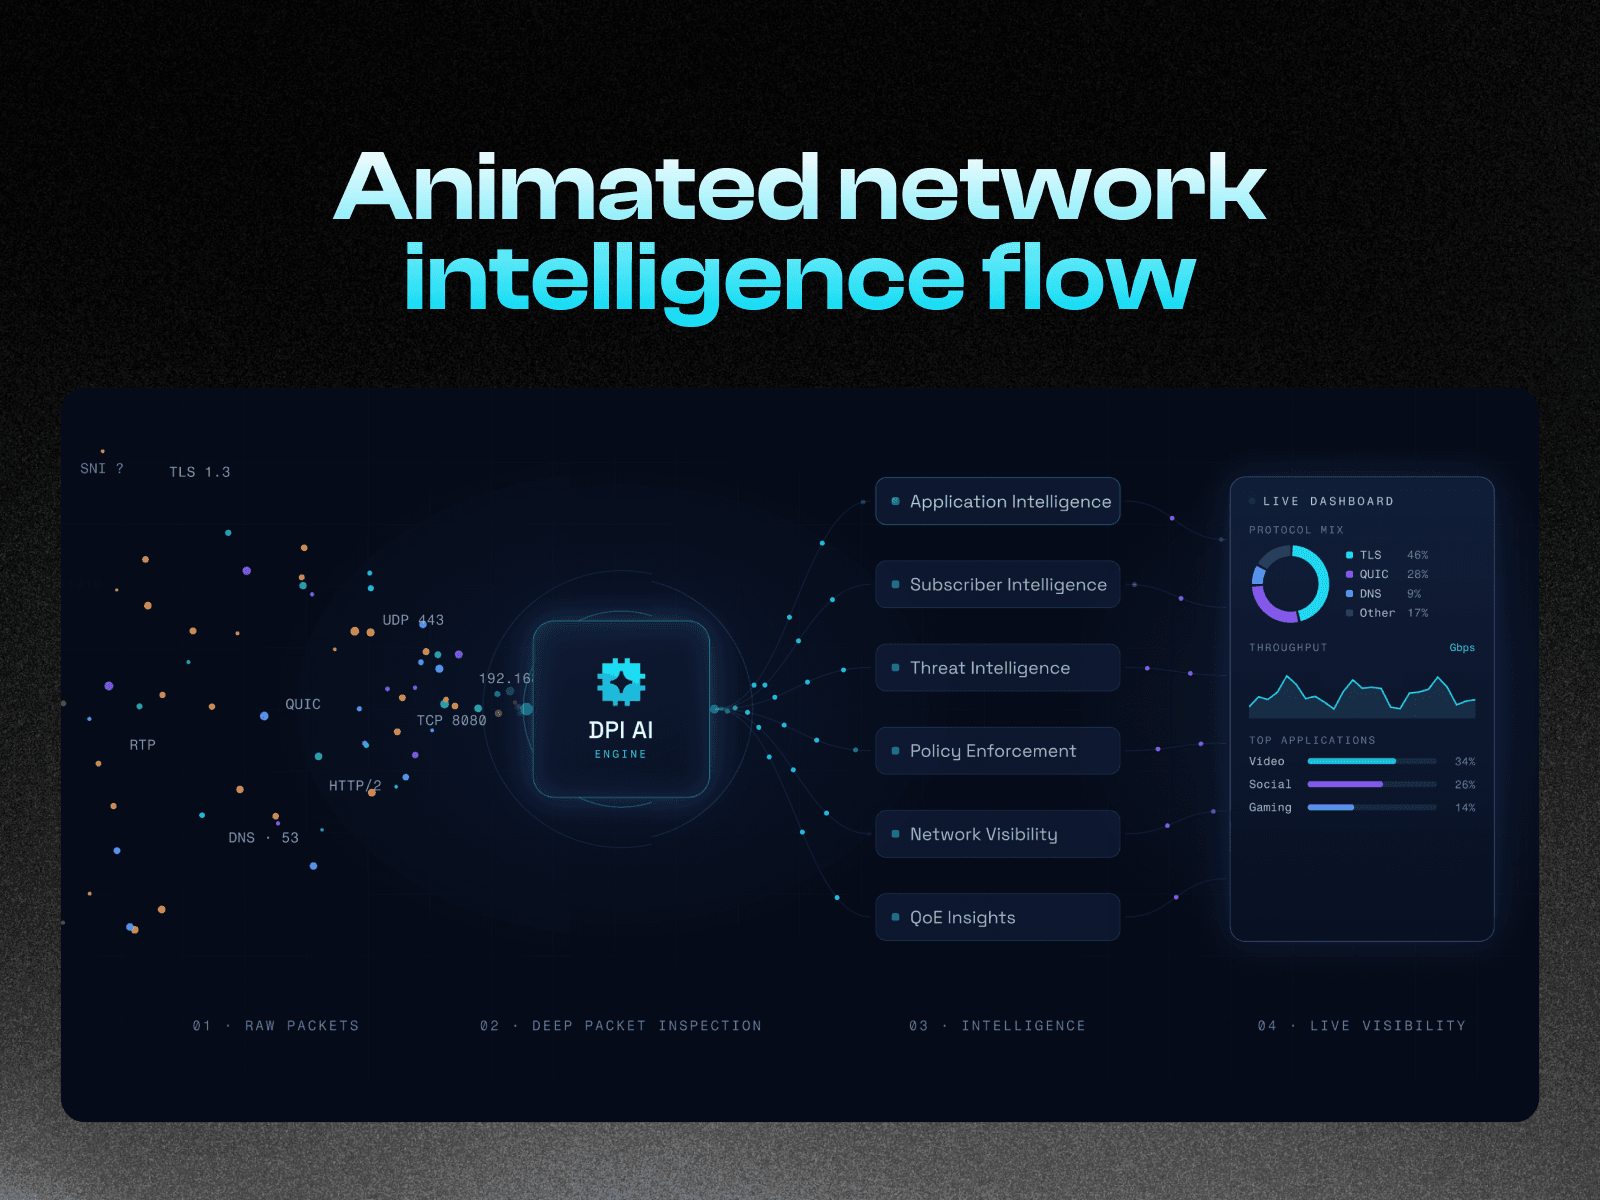
The Futuristic Donut Chart is a next-gen data visualization component for Framer. Built with full customization in mind, it lets you showcase progress, percentages, or values in style. Choose from multiple futuristic skins like Neon, Glow, Glass, or Minimal — all with animated gradients and smooth motion.
Easily adjust size, thickness, colors, and fonts. Add icons or images to the center, toggle between percentage or absolute values, and adapt it to dark/light modes. Ideal for dashboards, portfolios, landing pages, and any project where data meets design.
✅ Features
🎨 Multiple Skins → Neon, Glow, Glass, Minimal
🌈 Custom Colors & Gradients → Full color control for progress + track
🔠 Font & Text Options → Choose font family, size, and colors
📊 Value Display → Show % or absolute value, with optional unit
🖼 Center Content → Add icons or custom images in the center
⚡ Smooth Animation → Progress bar animates on load with motion effects
🌗 Dark/Light Ready → Works beautifully in any theme
📐 Size & Thickness Controls → Fully scalable
💡 Use Cases
KPI dashboards and analytics
Fitness / productivity progress tracking
Portfolio stats & achievements
Fundraising / campaign progress meters
App landing pages with animated data
Gamification elements
🛠 Built For
Designers & developers who need futuristic progress charts
Framer creators building dashboards, SaaS, or modern landing pages
Teams who want interactive, animated data visualization
📌 Instructions
Drag the Futuristic Donut Chart component onto your canvas.
Adjust Value and Max to control the progress.
Pick a Skin (Minimal, Glass, Neon, Glow).
Customize Gradient Colors, Track Color, Text Color, and Font.
Toggle Show Value or add a Center Icon/Image.
Scale using Size & Thickness controls.