About 33 Bubble Chart
What it does
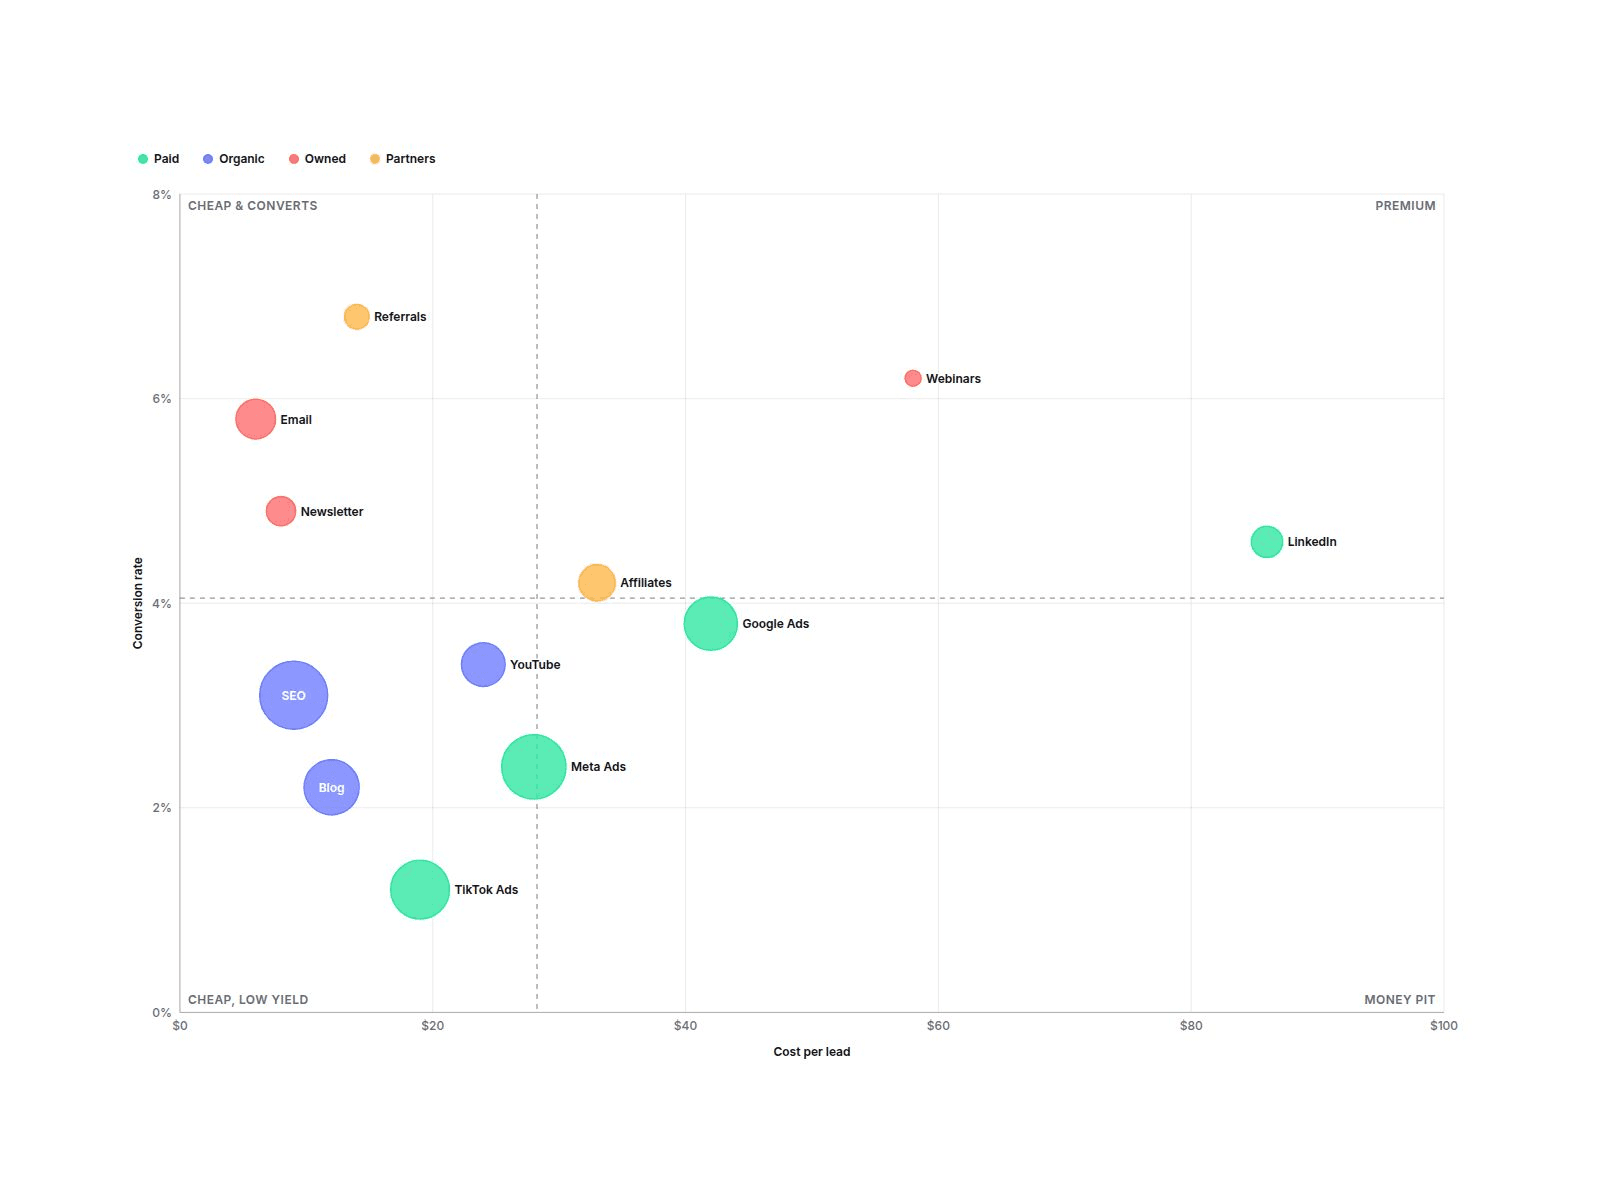
A real bubble chart for your site. Give each point an X value, a Y value and a size value, and it plots them on clean numeric axes: bubble area shows the third number, colors show the group. Looks finished on install with 12 sample marketing channels.
Customizable properties
• Points (up to 40): label, X, Y, size value and group
• Axes: titles, auto or manual range, tick count, gridlines, tick labels
• Bubbles: min / max radius, size by area or linear, opacity, labels
• 6 group colors with a legend: click a group to hide or show it
• Quadrant lines at the center, the data average or your own value, with names
• Hover tooltip with label, X, Y and size value
• Number format per value: prefix, suffix, decimals, thousands, k / M
• Light / Dark, custom colors, fonts, corner radius, padding
Why this component
• Real numbers, not an illustration: axes pick tidy tick steps for you.
• Bubbles pop in once when scrolled into view, then stop. Canvas and static export show the finished chart.
• Resizes cleanly: text stays crisp while the plot stretches.
• Keyboard focusable, with screen-reader summaries for every bubble.
Need help?
Reach out anytime at hello@brandingupstudio.com. We usually reply within 1 business day.
Need more? All 10 paid BrandingUp components in one payment: All-Access Pass, $49 → https://brandingup.lemonsqueezy.com/checkout/buy/3391c106-6fbc-41b8-9cc8-b63365b95665
Built with code but fully customizable via property controls, no coding needed. Unlink is not provided so we can keep delivering updates. When an update is available, just click the Update button on the component.