About 36 Waffle Chart
What it does
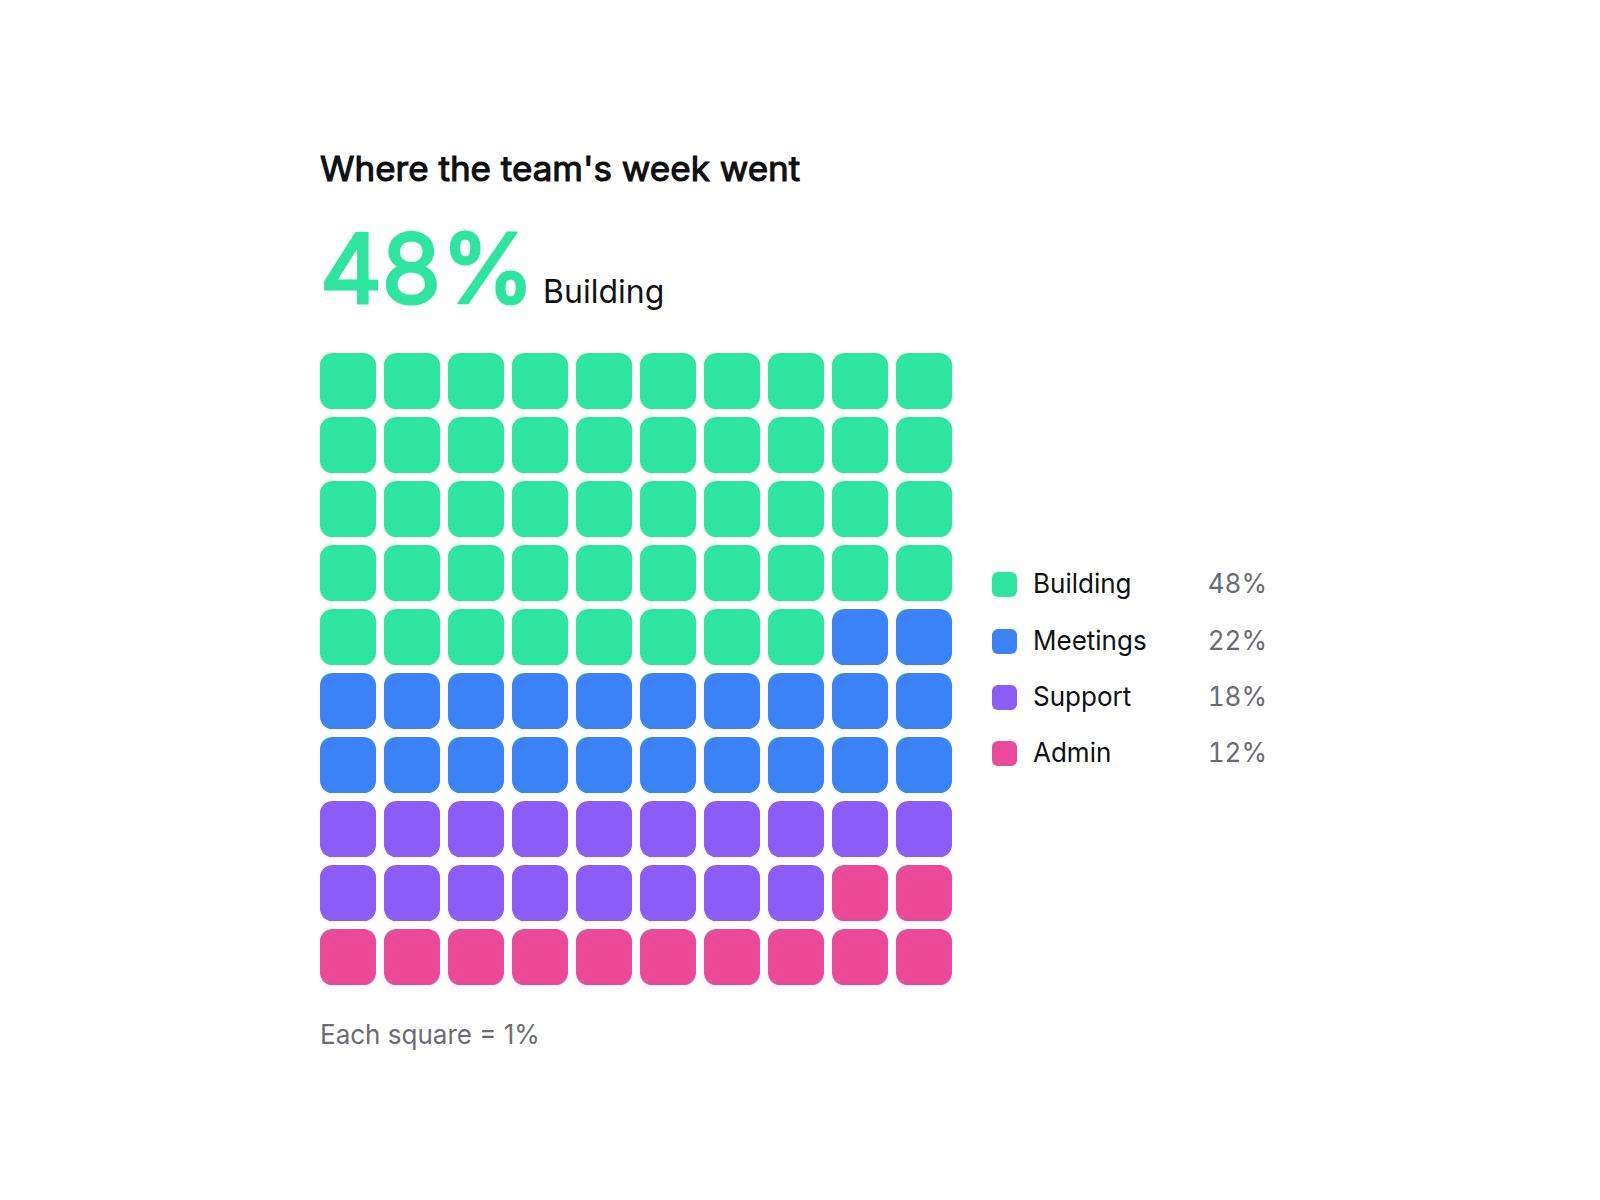
A waffle chart that turns numbers into squares. Type one item per line (Building, 48) and it splits a 10×10 grid between them, so "48%" becomes 48 colored squares. Values don't need to add up to 100: any numbers are converted to shares, and the squares always add up exactly. Looks finished on install with demo data.
Customizable properties
• Data: one line per item, or paste spreadsheet columns. Add #HEX to a line for its own color
• Layout: one combined grid, or one grid per item (split view)
• Square shape: square, rounded, circle, person, heart, star or your own SVG path
• Big number above the grid: 48%, "5 in 10" or the value itself
• Total: set it (e.g. 100) to leave the rest of the squares empty, for goals and progress
• Grid size up to 20×20, fill by rows, columns or bottom up
• Legend beside or below the grid with percent, value or both
• Number format: prefix, suffix, decimals, locale
• 7 color themes or your own color: solid, shades or one color per item
• Light / Dark, custom colors, fonts, text scale, square size and gap, hover tooltip
Why this component
• Squares are shared out with the largest-remainder method, so the grid never shows 99 or 101 squares.
• Sizes itself to the width it is given, not the window. The legend moves under the grid when space is tight.
• Squares pop in once when scrolled into view, then stop. Canvas and static export show the finished chart.
• Keyboard friendly: focus the chart and use the arrow keys to highlight each item.
Need help?
Reach out anytime at hello@brandingupstudio.com. We usually reply within 1 business day.
Need more? All 10 paid BrandingUp components in one payment: All-Access Pass, $49 → https://brandingup.lemonsqueezy.com/checkout/buy/3391c106-6fbc-41b8-9cc8-b63365b95665
Built with code but fully customizable via property controls, no coding needed. Unlink is not provided so we can keep delivering updates.