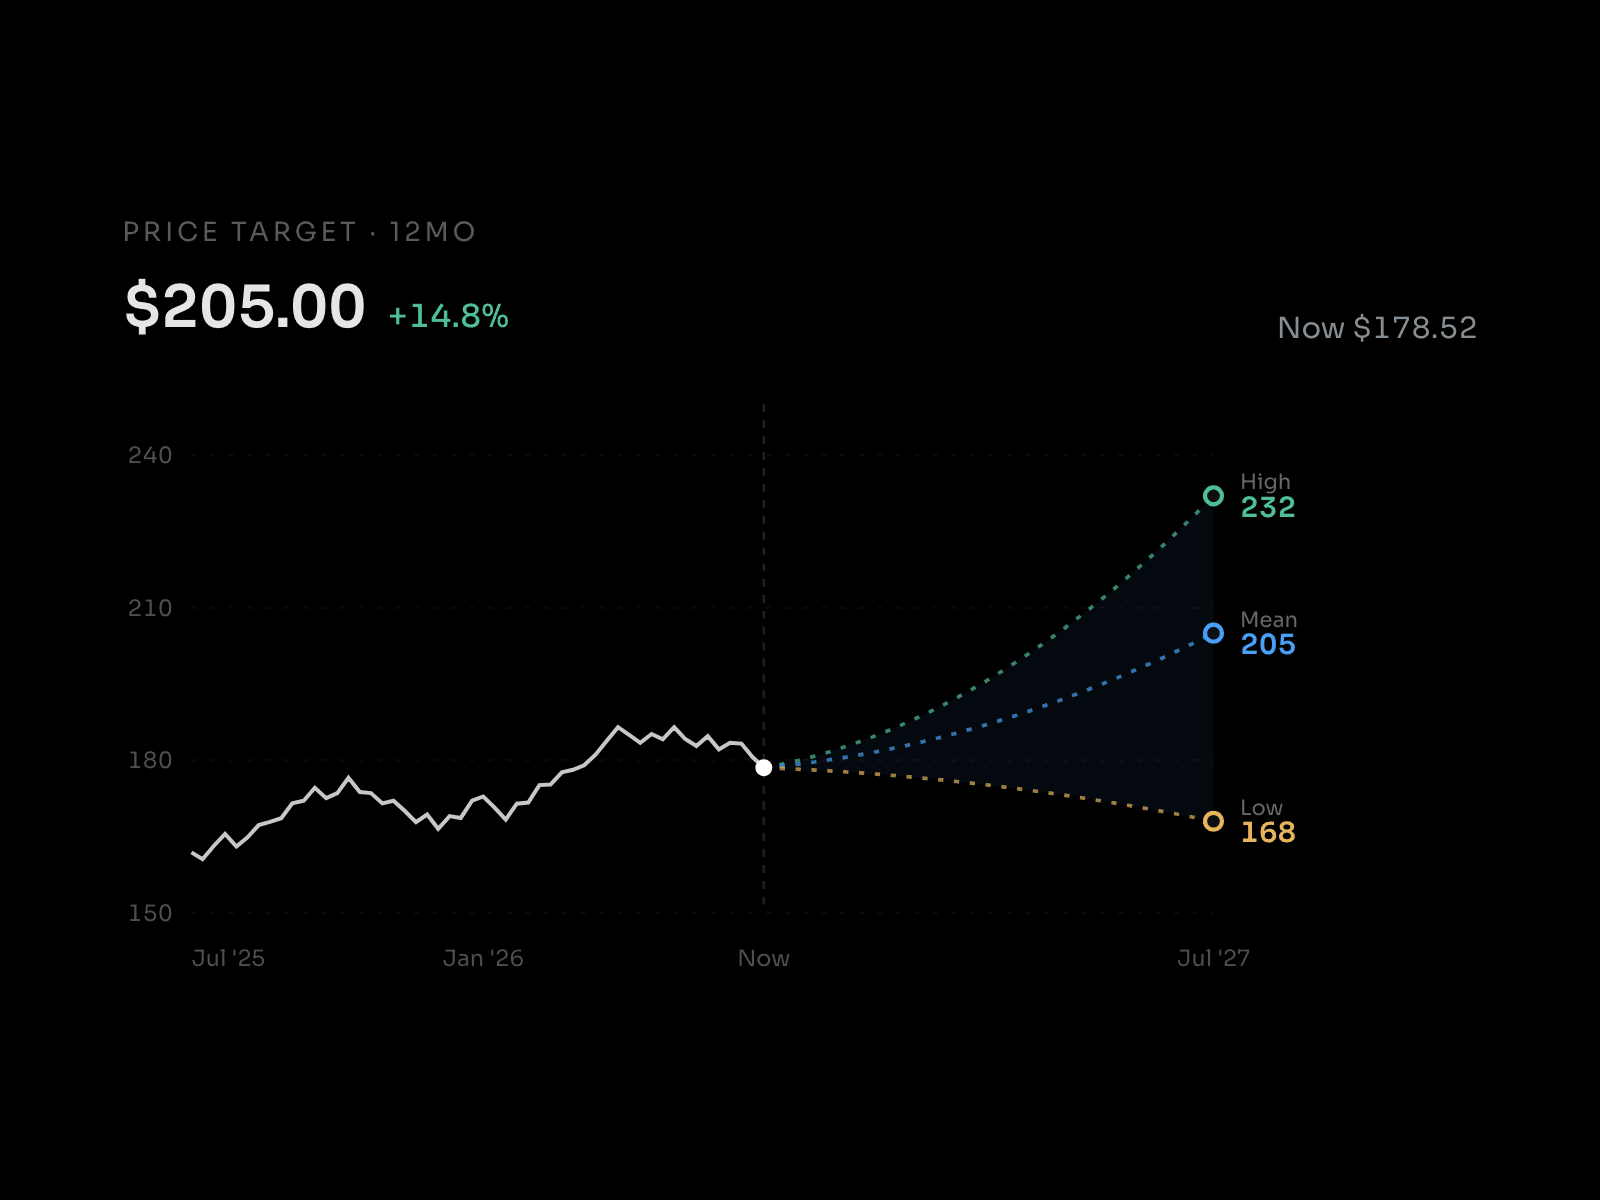
Analyst price targets drawn as a fan chart. Price history walks up to today, then three dashed projections fan out to the high, mean and low target, each labelled with how many analysts sit behind it.
What it does
Three projections. High, mean and low fan forward from the last real price. Each ends in a label with its value and analyst count.
Hover to isolate. Hover a target and the other two dim so you can read one path cleanly.
Scrubbable history. Drag back across the solid part of the line to read prices from earlier weeks.
Delta maths. Each target shows its distance from now as (target - now) / now, signed and coloured, so the upside or downside reads without arithmetic.
Every number is a control. Now, high, mean, low and the three analyst counts are all panel fields. No code needed to point it at a different stock.
Draw in animation. History draws first, then the fan opens. Reduced motion users get the final state.
Best for
Equity research products, investing newsletters, brokerage and analyst pages, and fintech sections that need to show forward looking data honestly.
How to use
1. Drop it on the canvas and give it width. The fan needs horizontal room to read.
2. Set the Label, for example "Price target · 12mo".
3. Set Now to the current price, then High, Mean and Low to your targets.
4. Set High #, Mean # and Low # to the analyst counts behind each one.
5. Pick a Theme and Accent.
6. Hover each target in preview to check the isolate behaviour.
History is sample data. The targets and counts are real inputs, so the fan and every delta are computed from what you type.

Analyst price targets drawn as a fan chart. Price history walks up to today, then three dashed projections fan out to the high, mean and low target, each labelled with how many analysts sit behind it.
What it does
Three projections. High, mean and low fan forward from the last real price. Each ends in a label with its value and analyst count.
Hover to isolate. Hover a target and the other two dim so you can read one path cleanly.
Scrubbable history. Drag back across the solid part of the line to read prices from earlier weeks.
Delta maths. Each target shows its distance from now as (target - now) / now, signed and coloured, so the upside or downside reads without arithmetic.
Every number is a control. Now, high, mean, low and the three analyst counts are all panel fields. No code needed to point it at a different stock.
Draw in animation. History draws first, then the fan opens. Reduced motion users get the final state.
Best for
Equity research products, investing newsletters, brokerage and analyst pages, and fintech sections that need to show forward looking data honestly.
How to use
1. Drop it on the canvas and give it width. The fan needs horizontal room to read.
2. Set the Label, for example "Price target · 12mo".
3. Set Now to the current price, then High, Mean and Low to your targets.
4. Set High #, Mean # and Low # to the analyst counts behind each one.
5. Pick a Theme and Accent.
6. Hover each target in preview to check the isolate behaviour.
History is sample data. The targets and counts are real inputs, so the fan and every delta are computed from what you type.